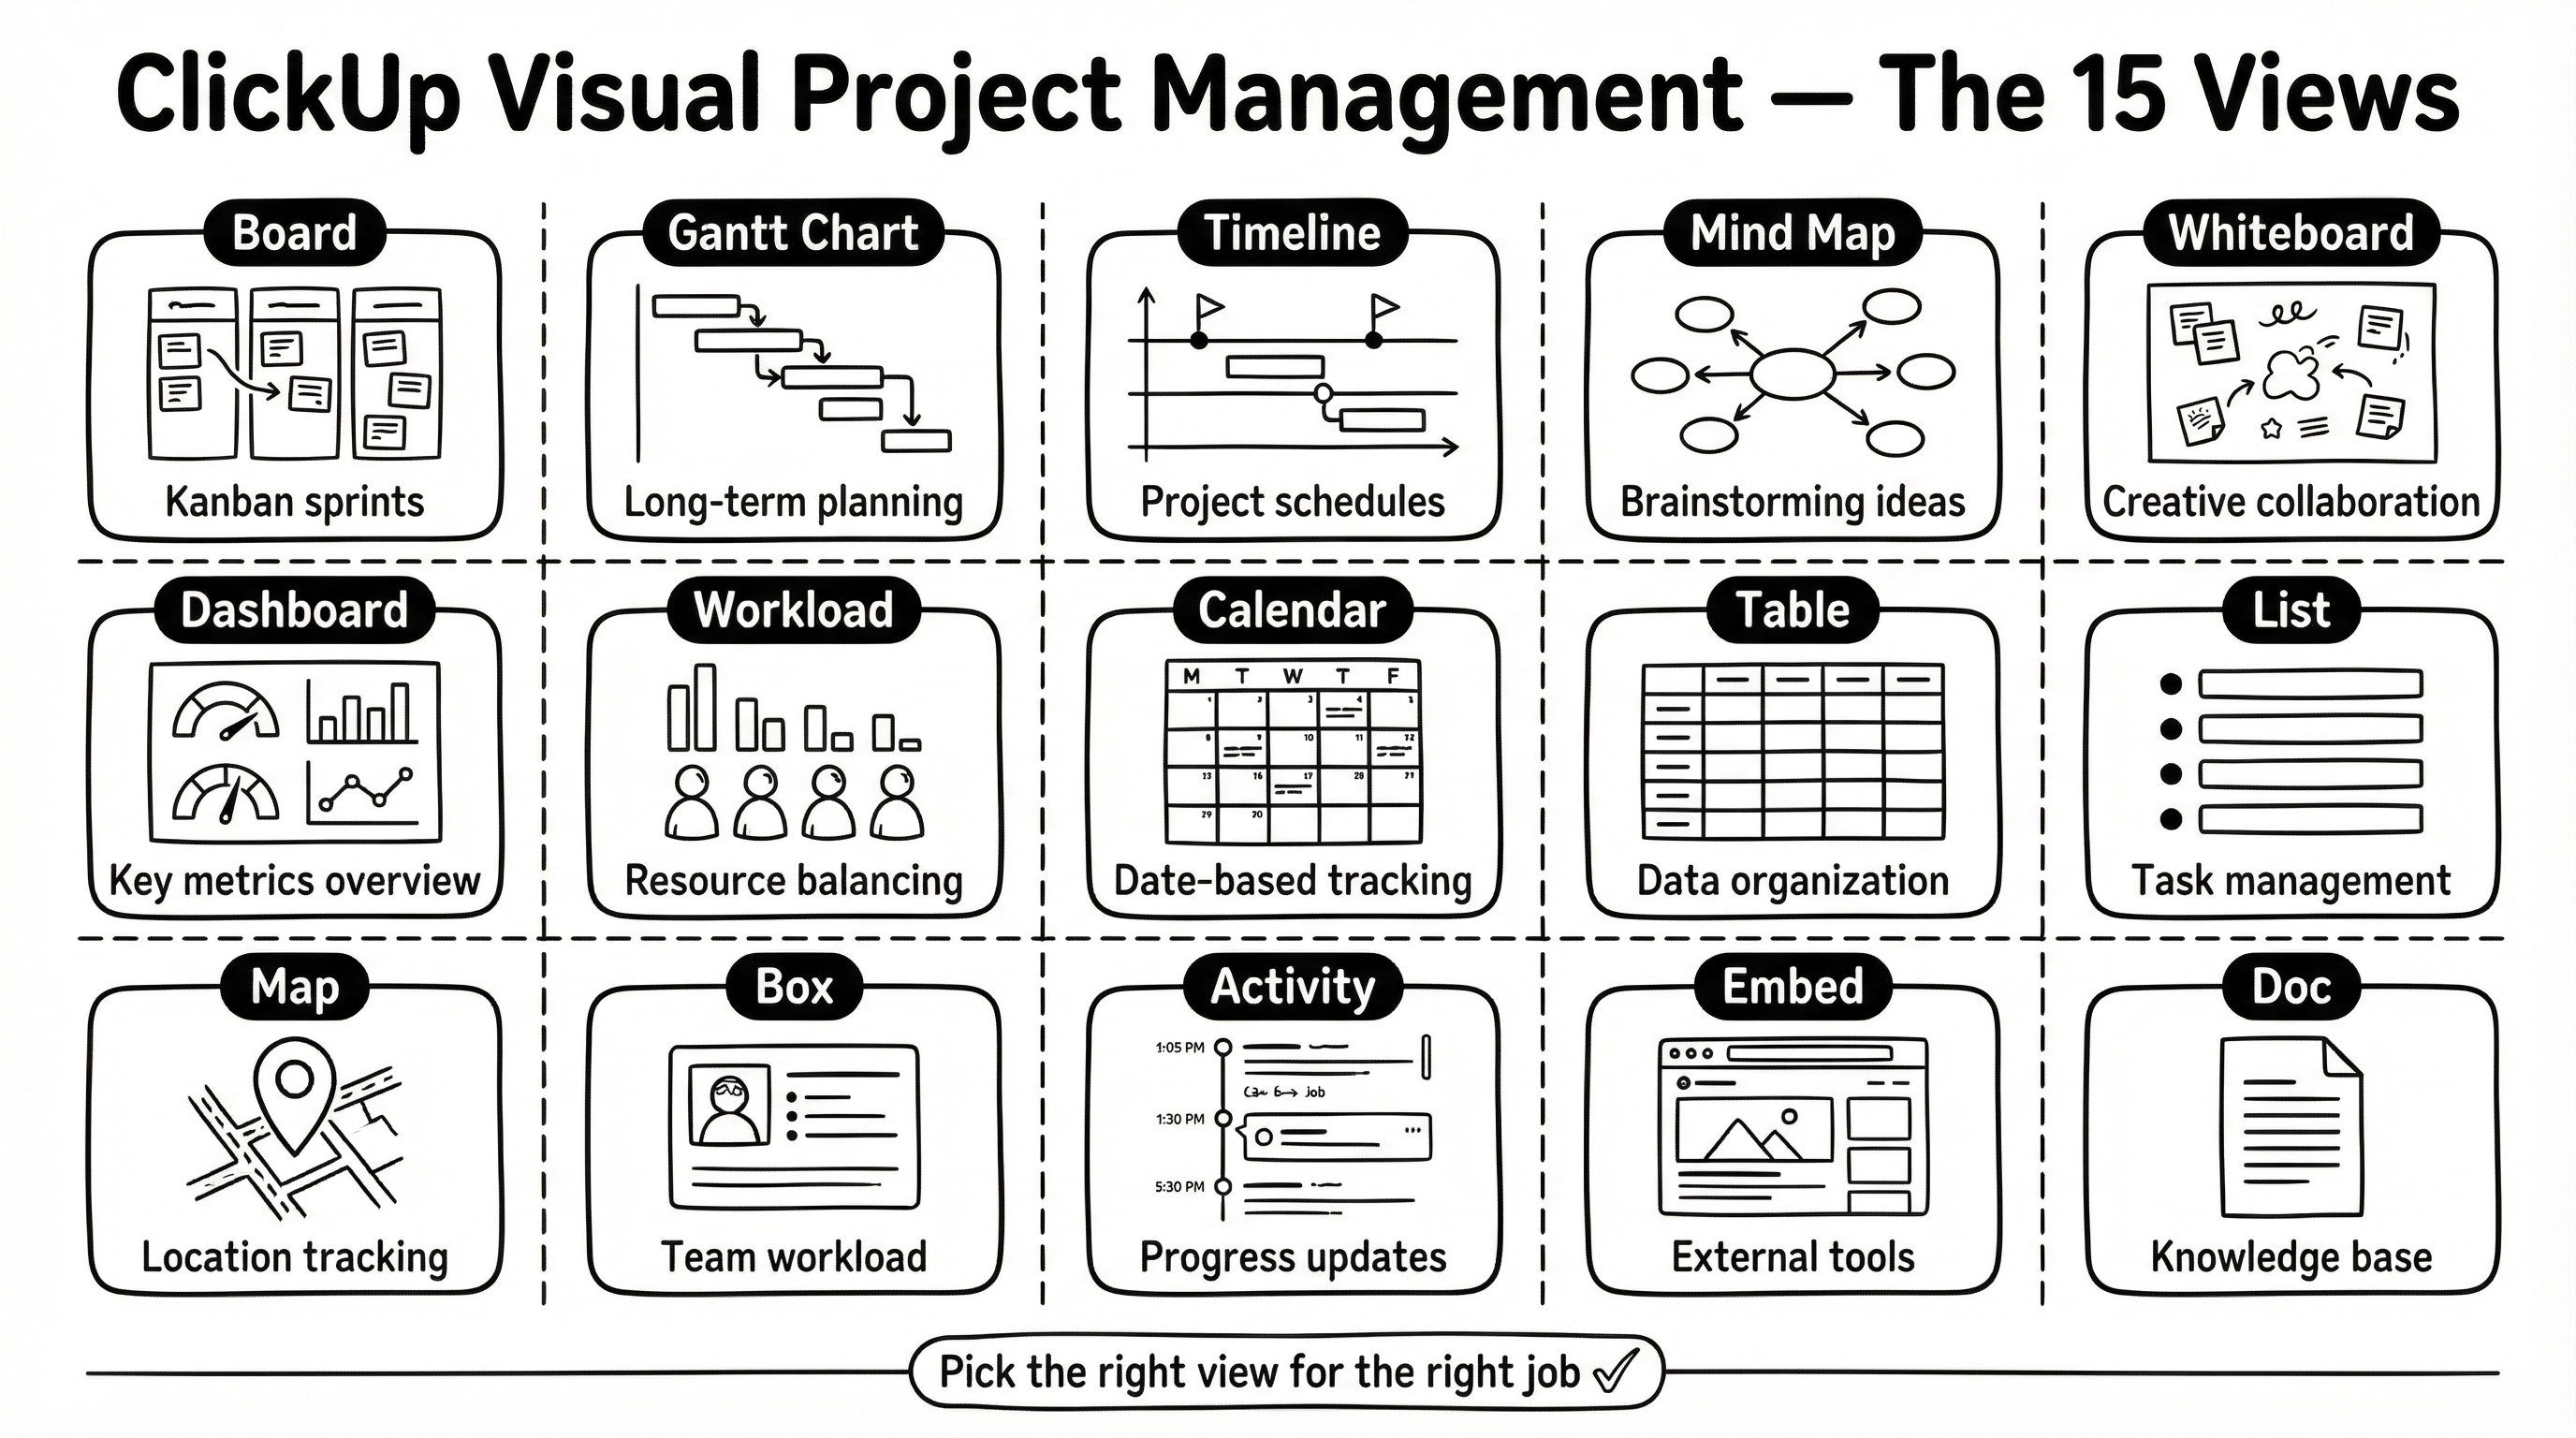
The 15 Views — Faithful Grid
Clean 3x5 grid showing every ClickUp view with hand-drawn icons and one-line descriptions. The classic whiteboard cheat sheet.
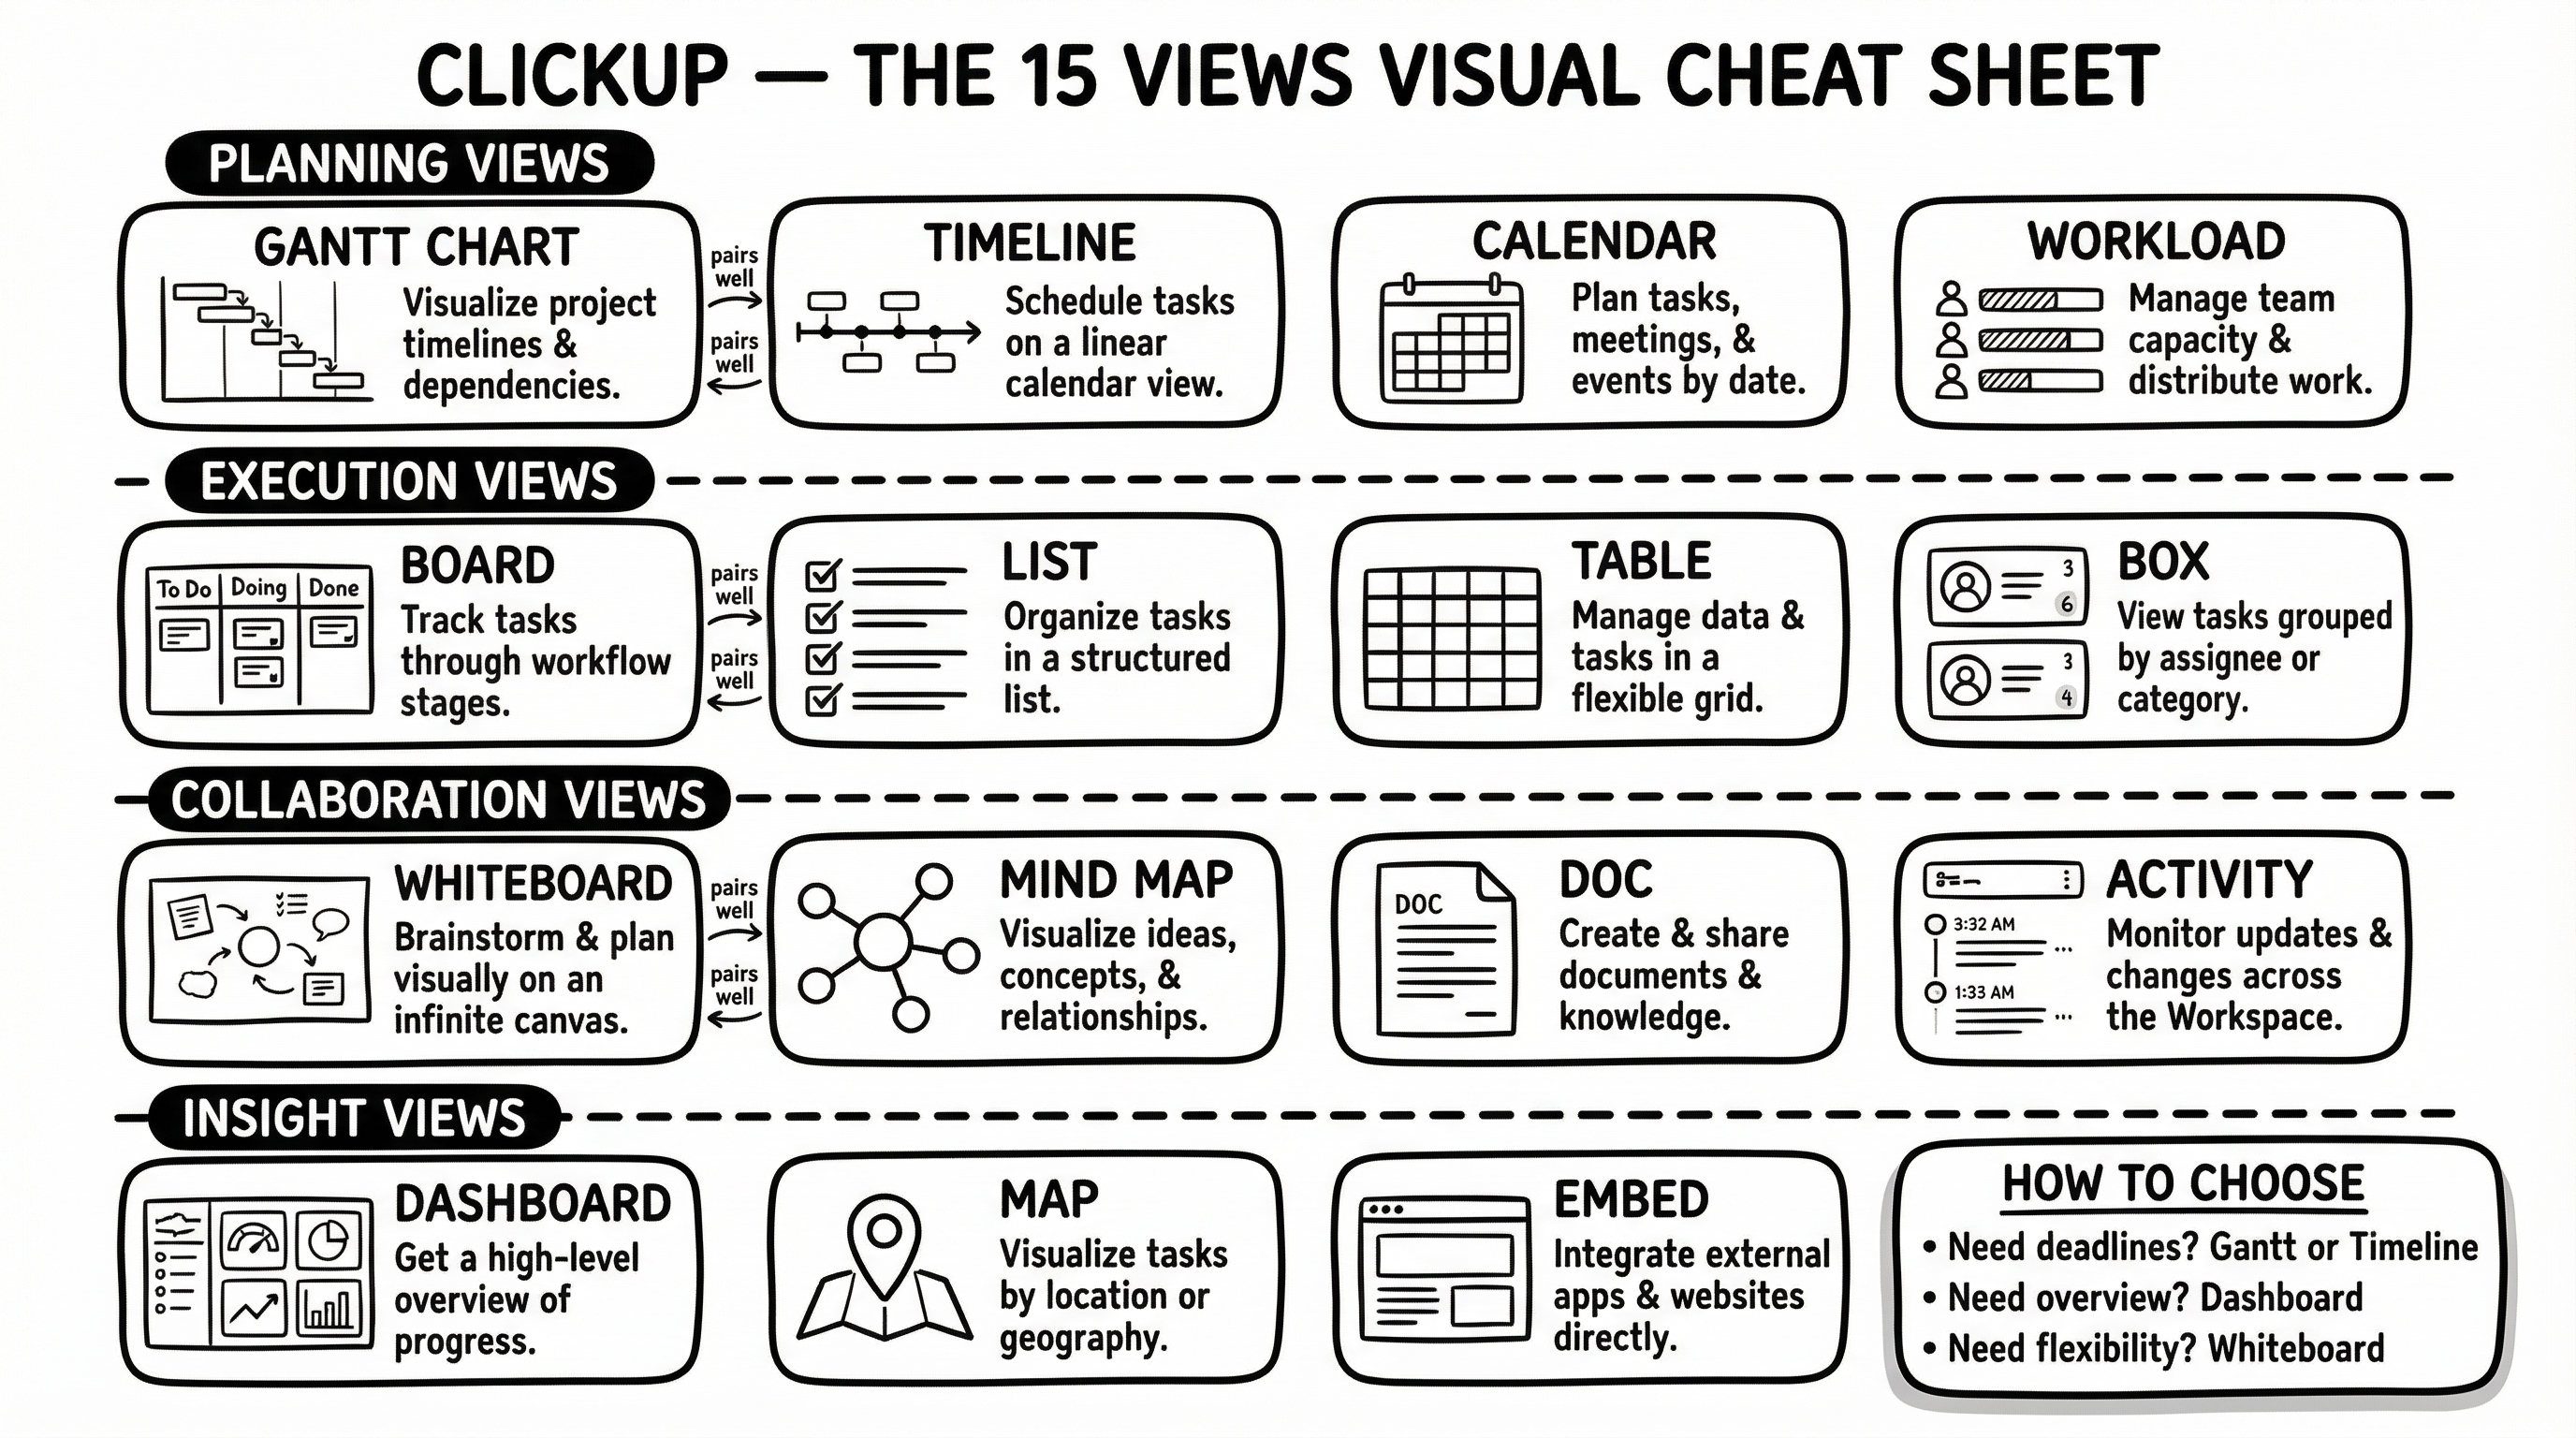
Visual Cheat Sheet — Categorized
Views organized by purpose: Planning, Execution, Collaboration, and Insight. Includes a "How to Choose" decision guide in the corner.
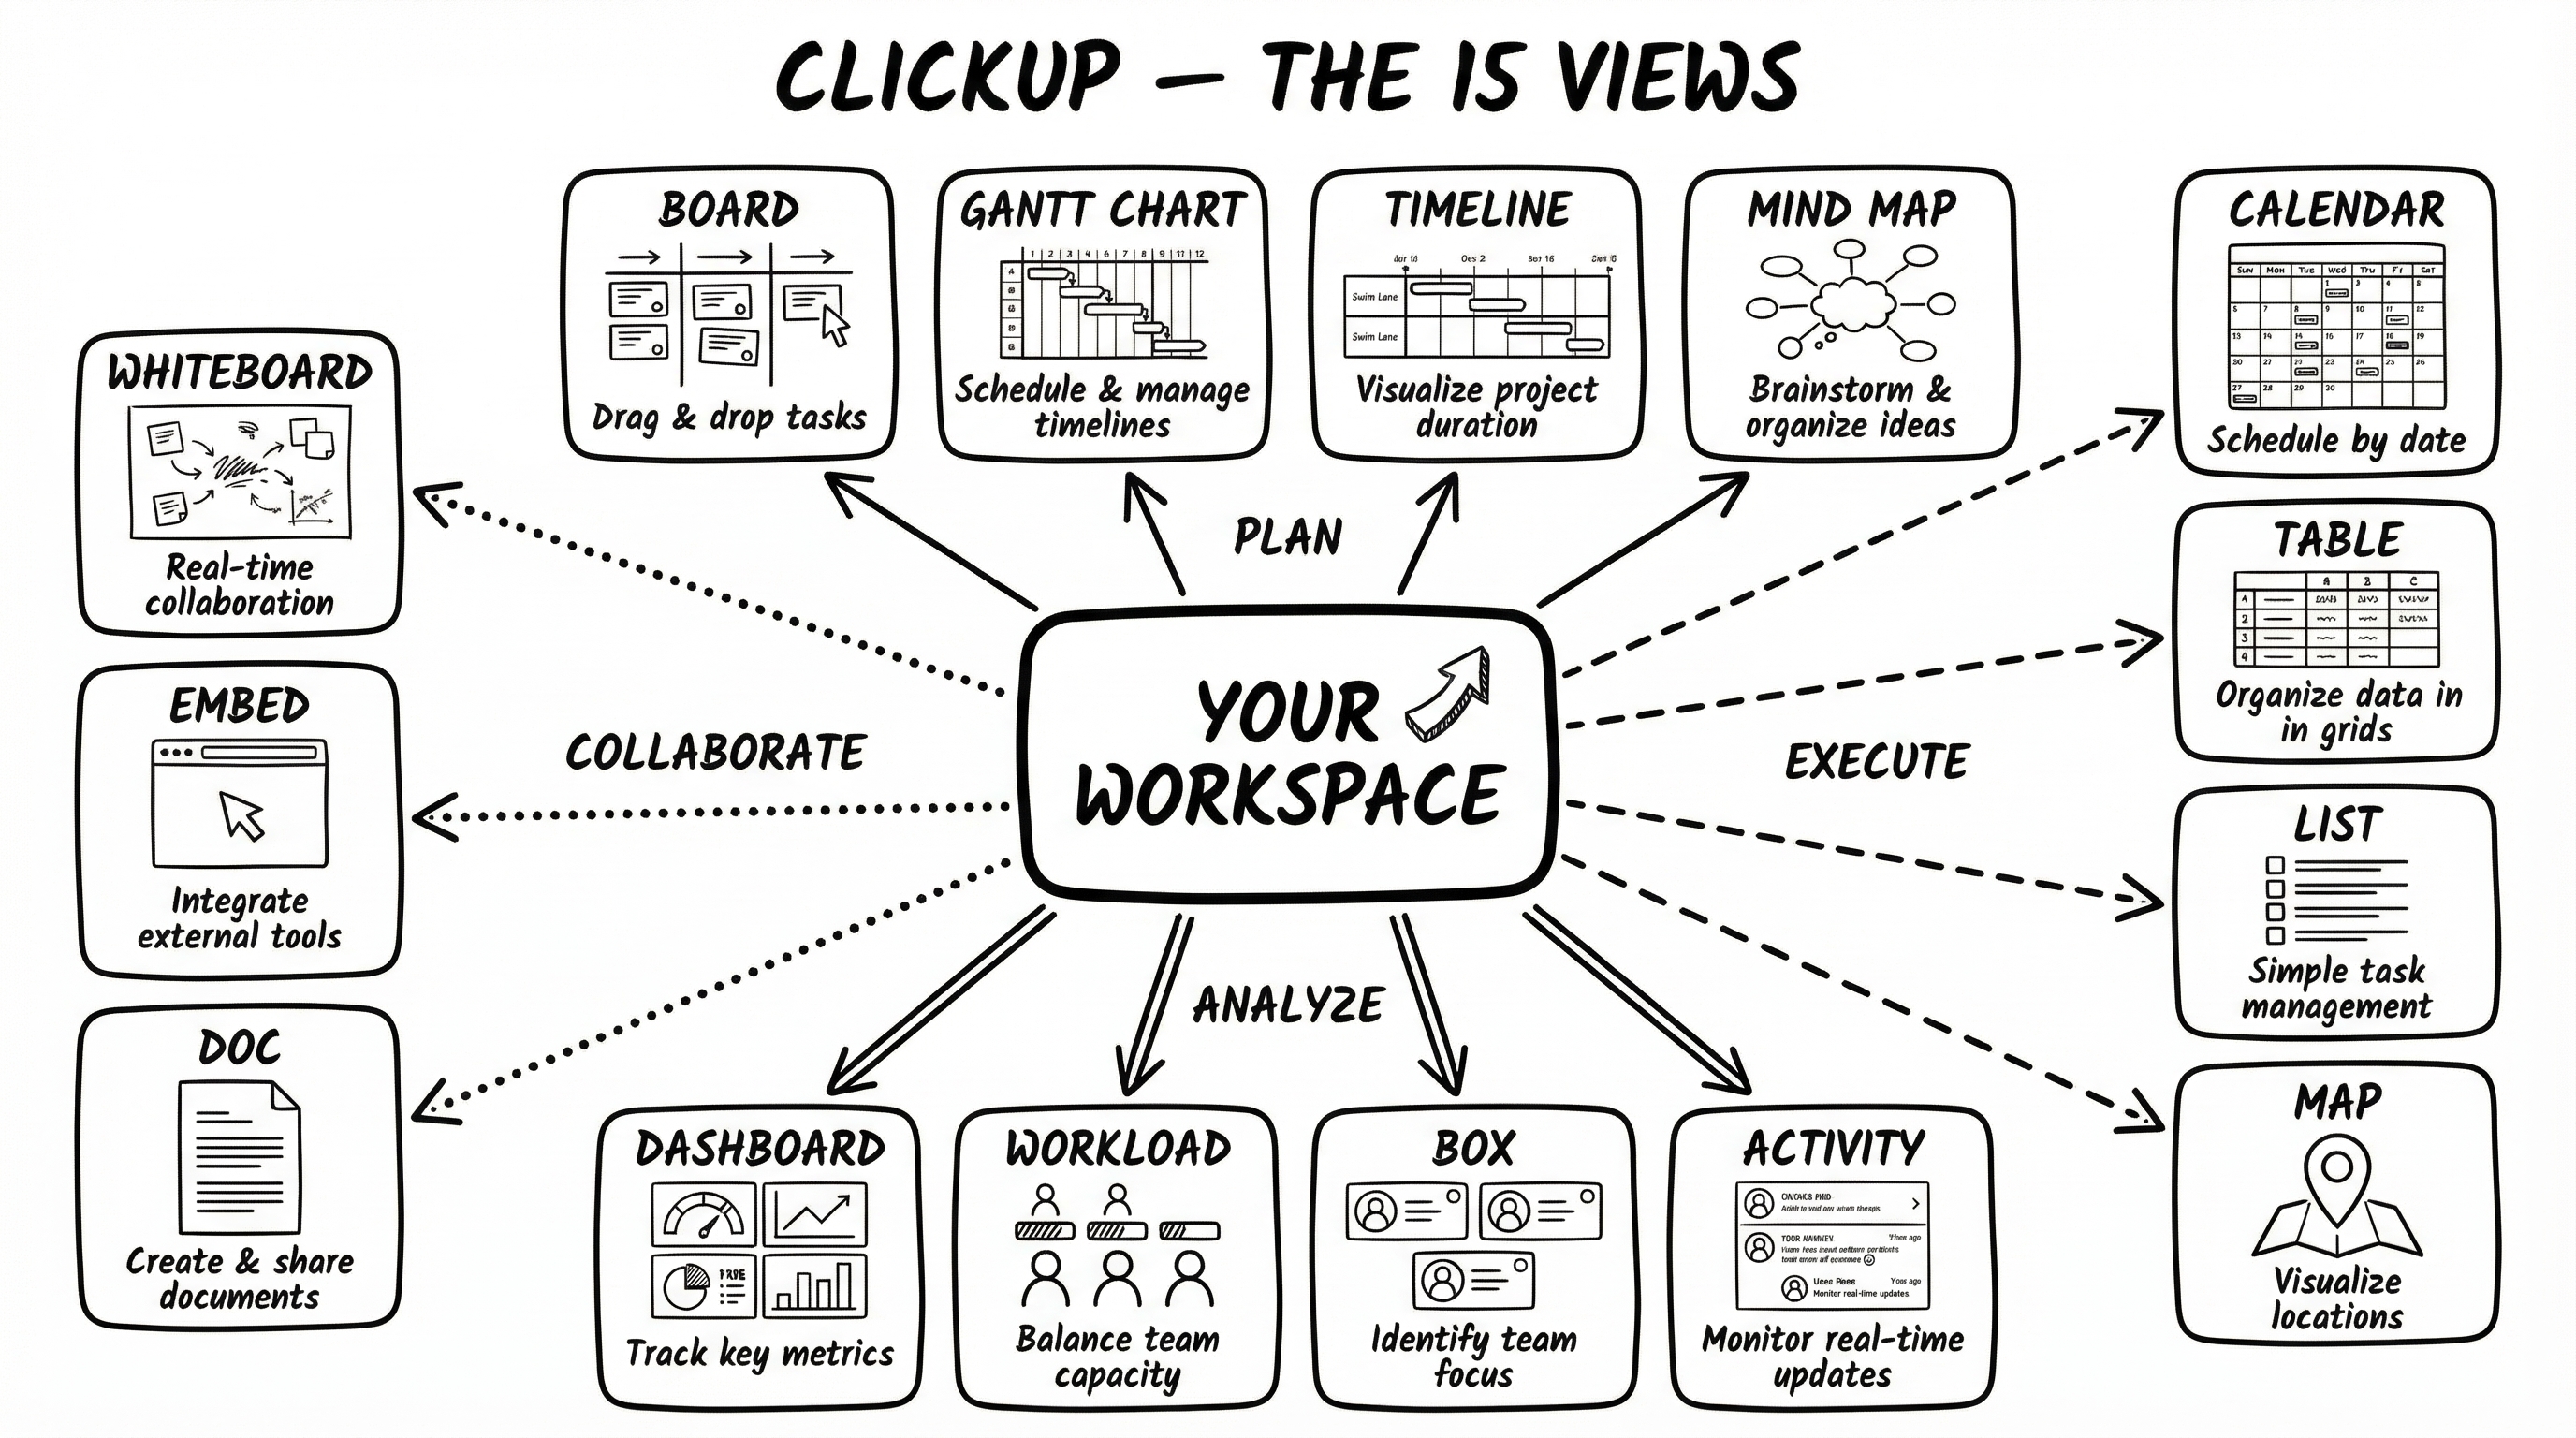
Hub & Spoke — Your Workspace
Radial mind map with your workspace at the center. Views radiate outward grouped by Plan, Execute, Collaborate, and Analyze quadrants.
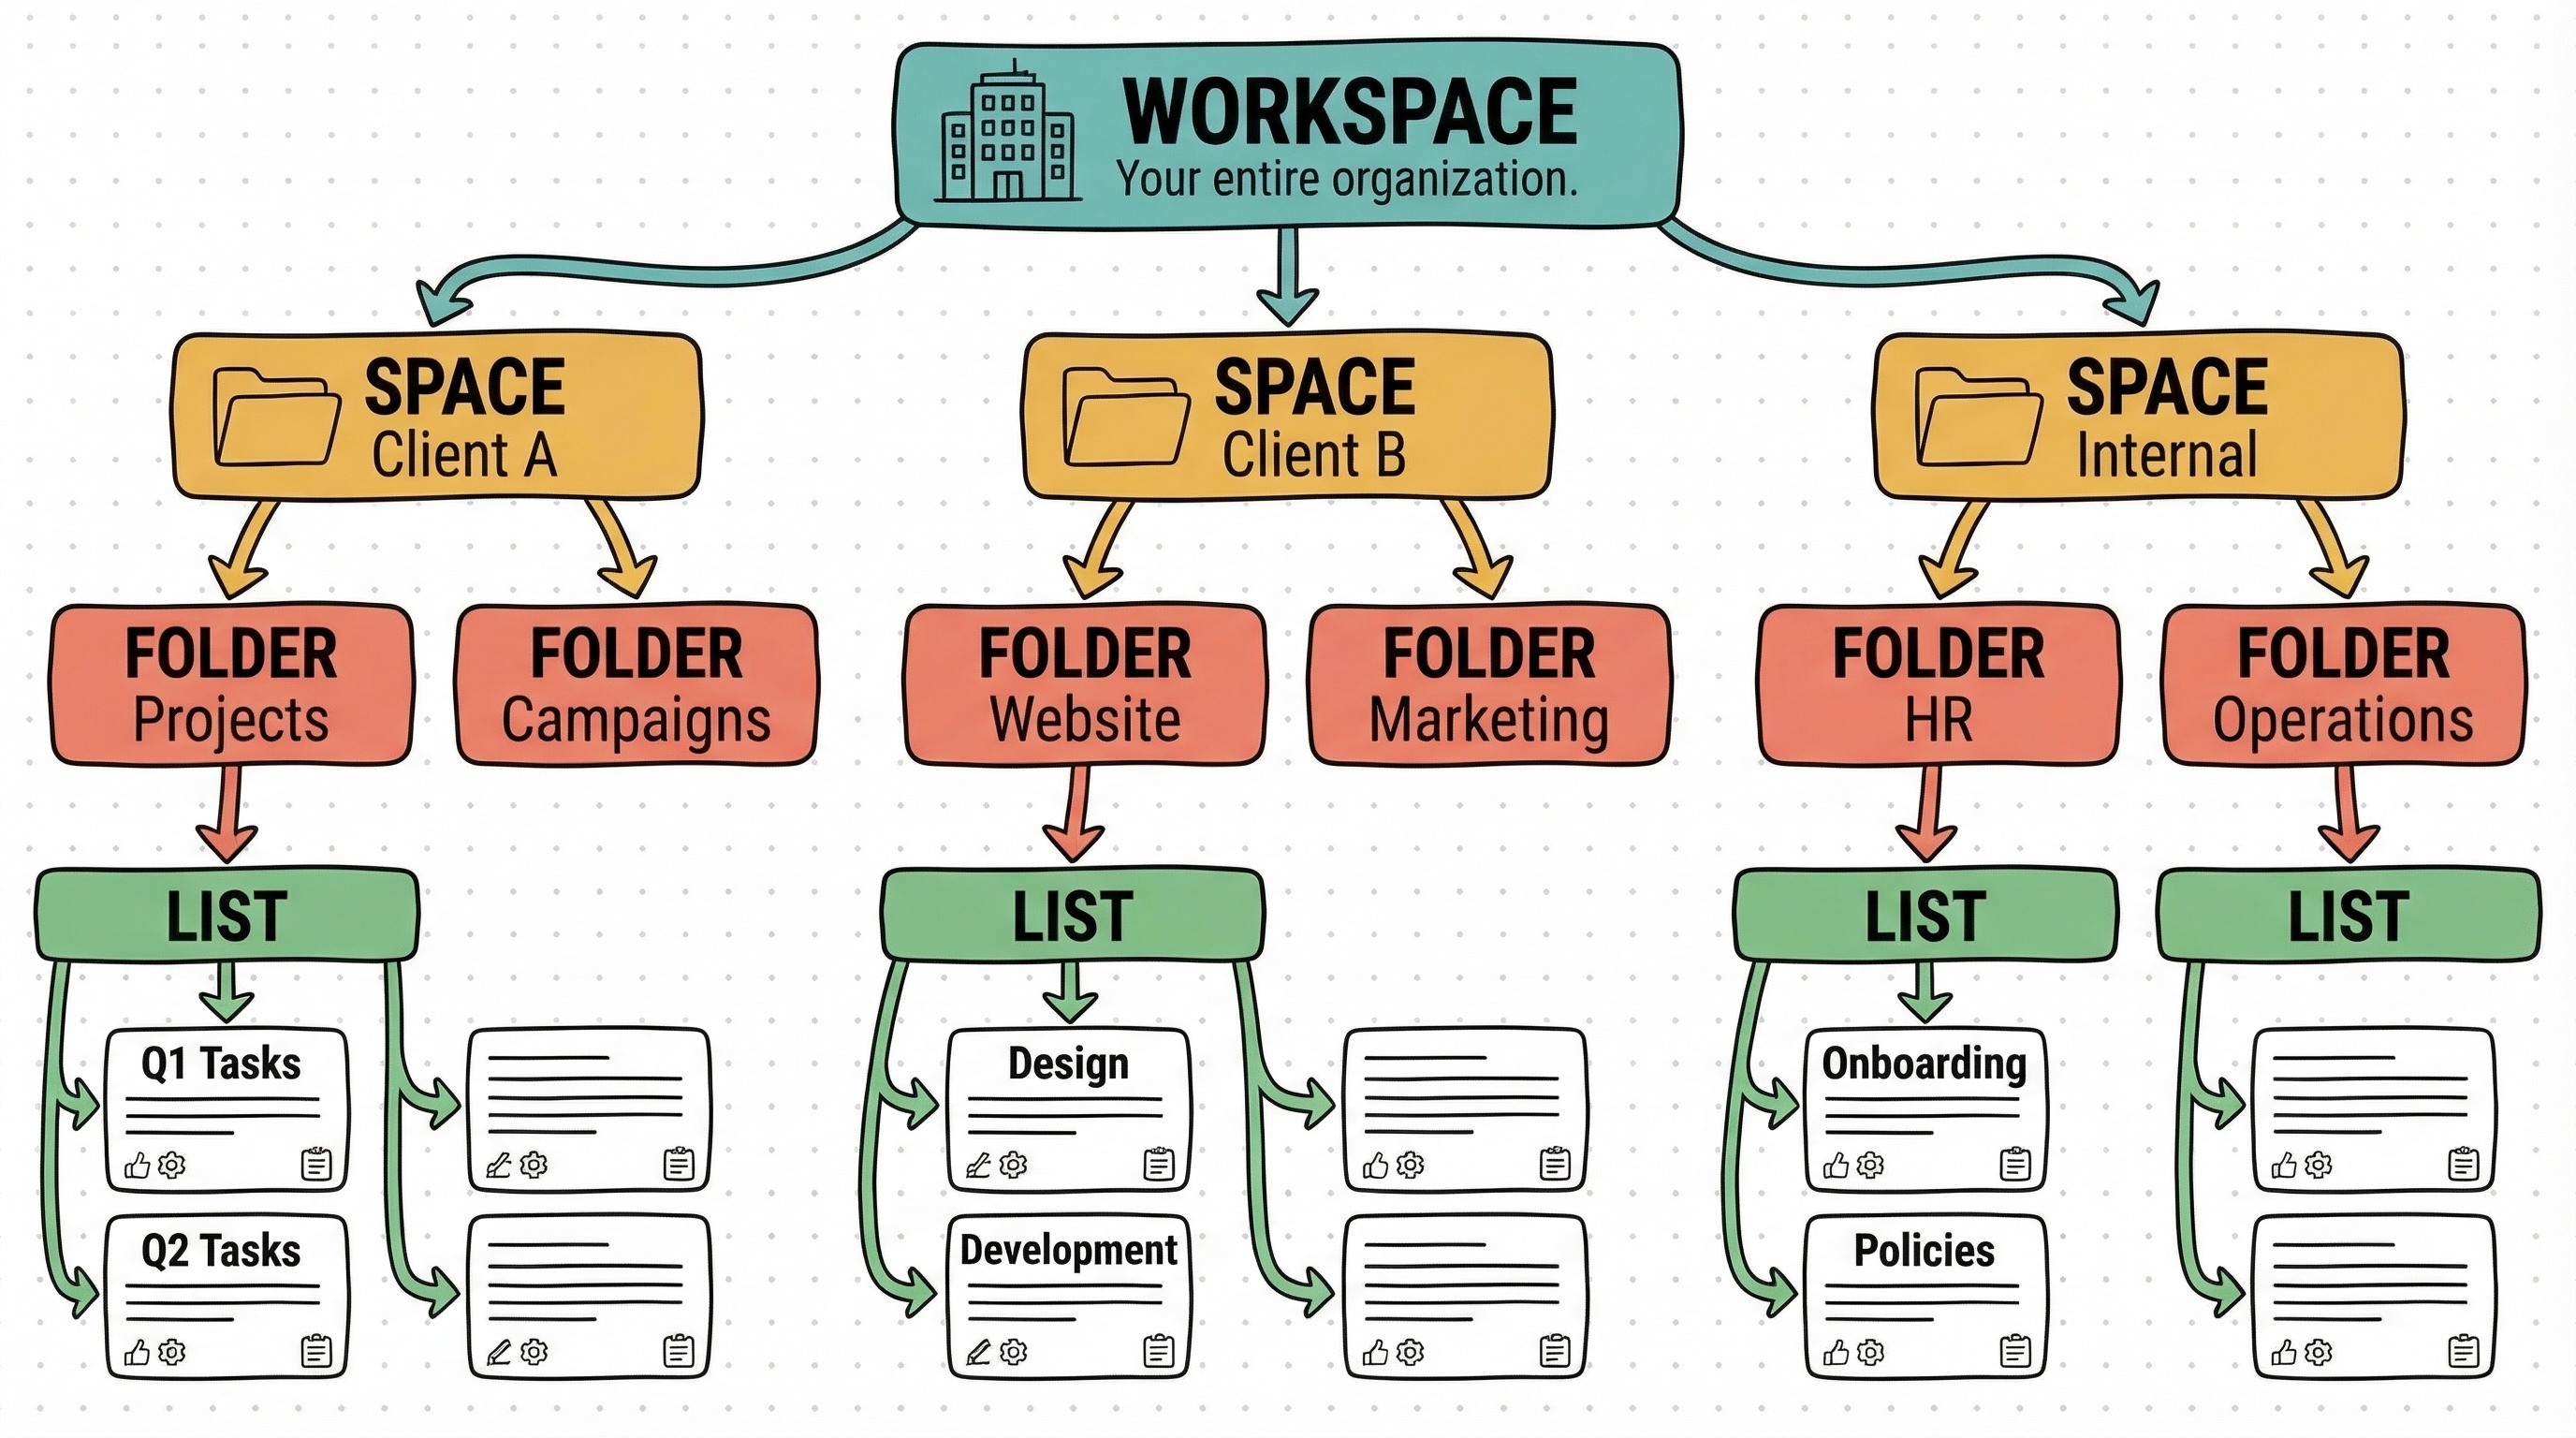
Workspace Hierarchy
Color-coded breakdown: Workspace → Spaces → Folders → Lists → Tasks. Teal, amber, coral, and green show each level.
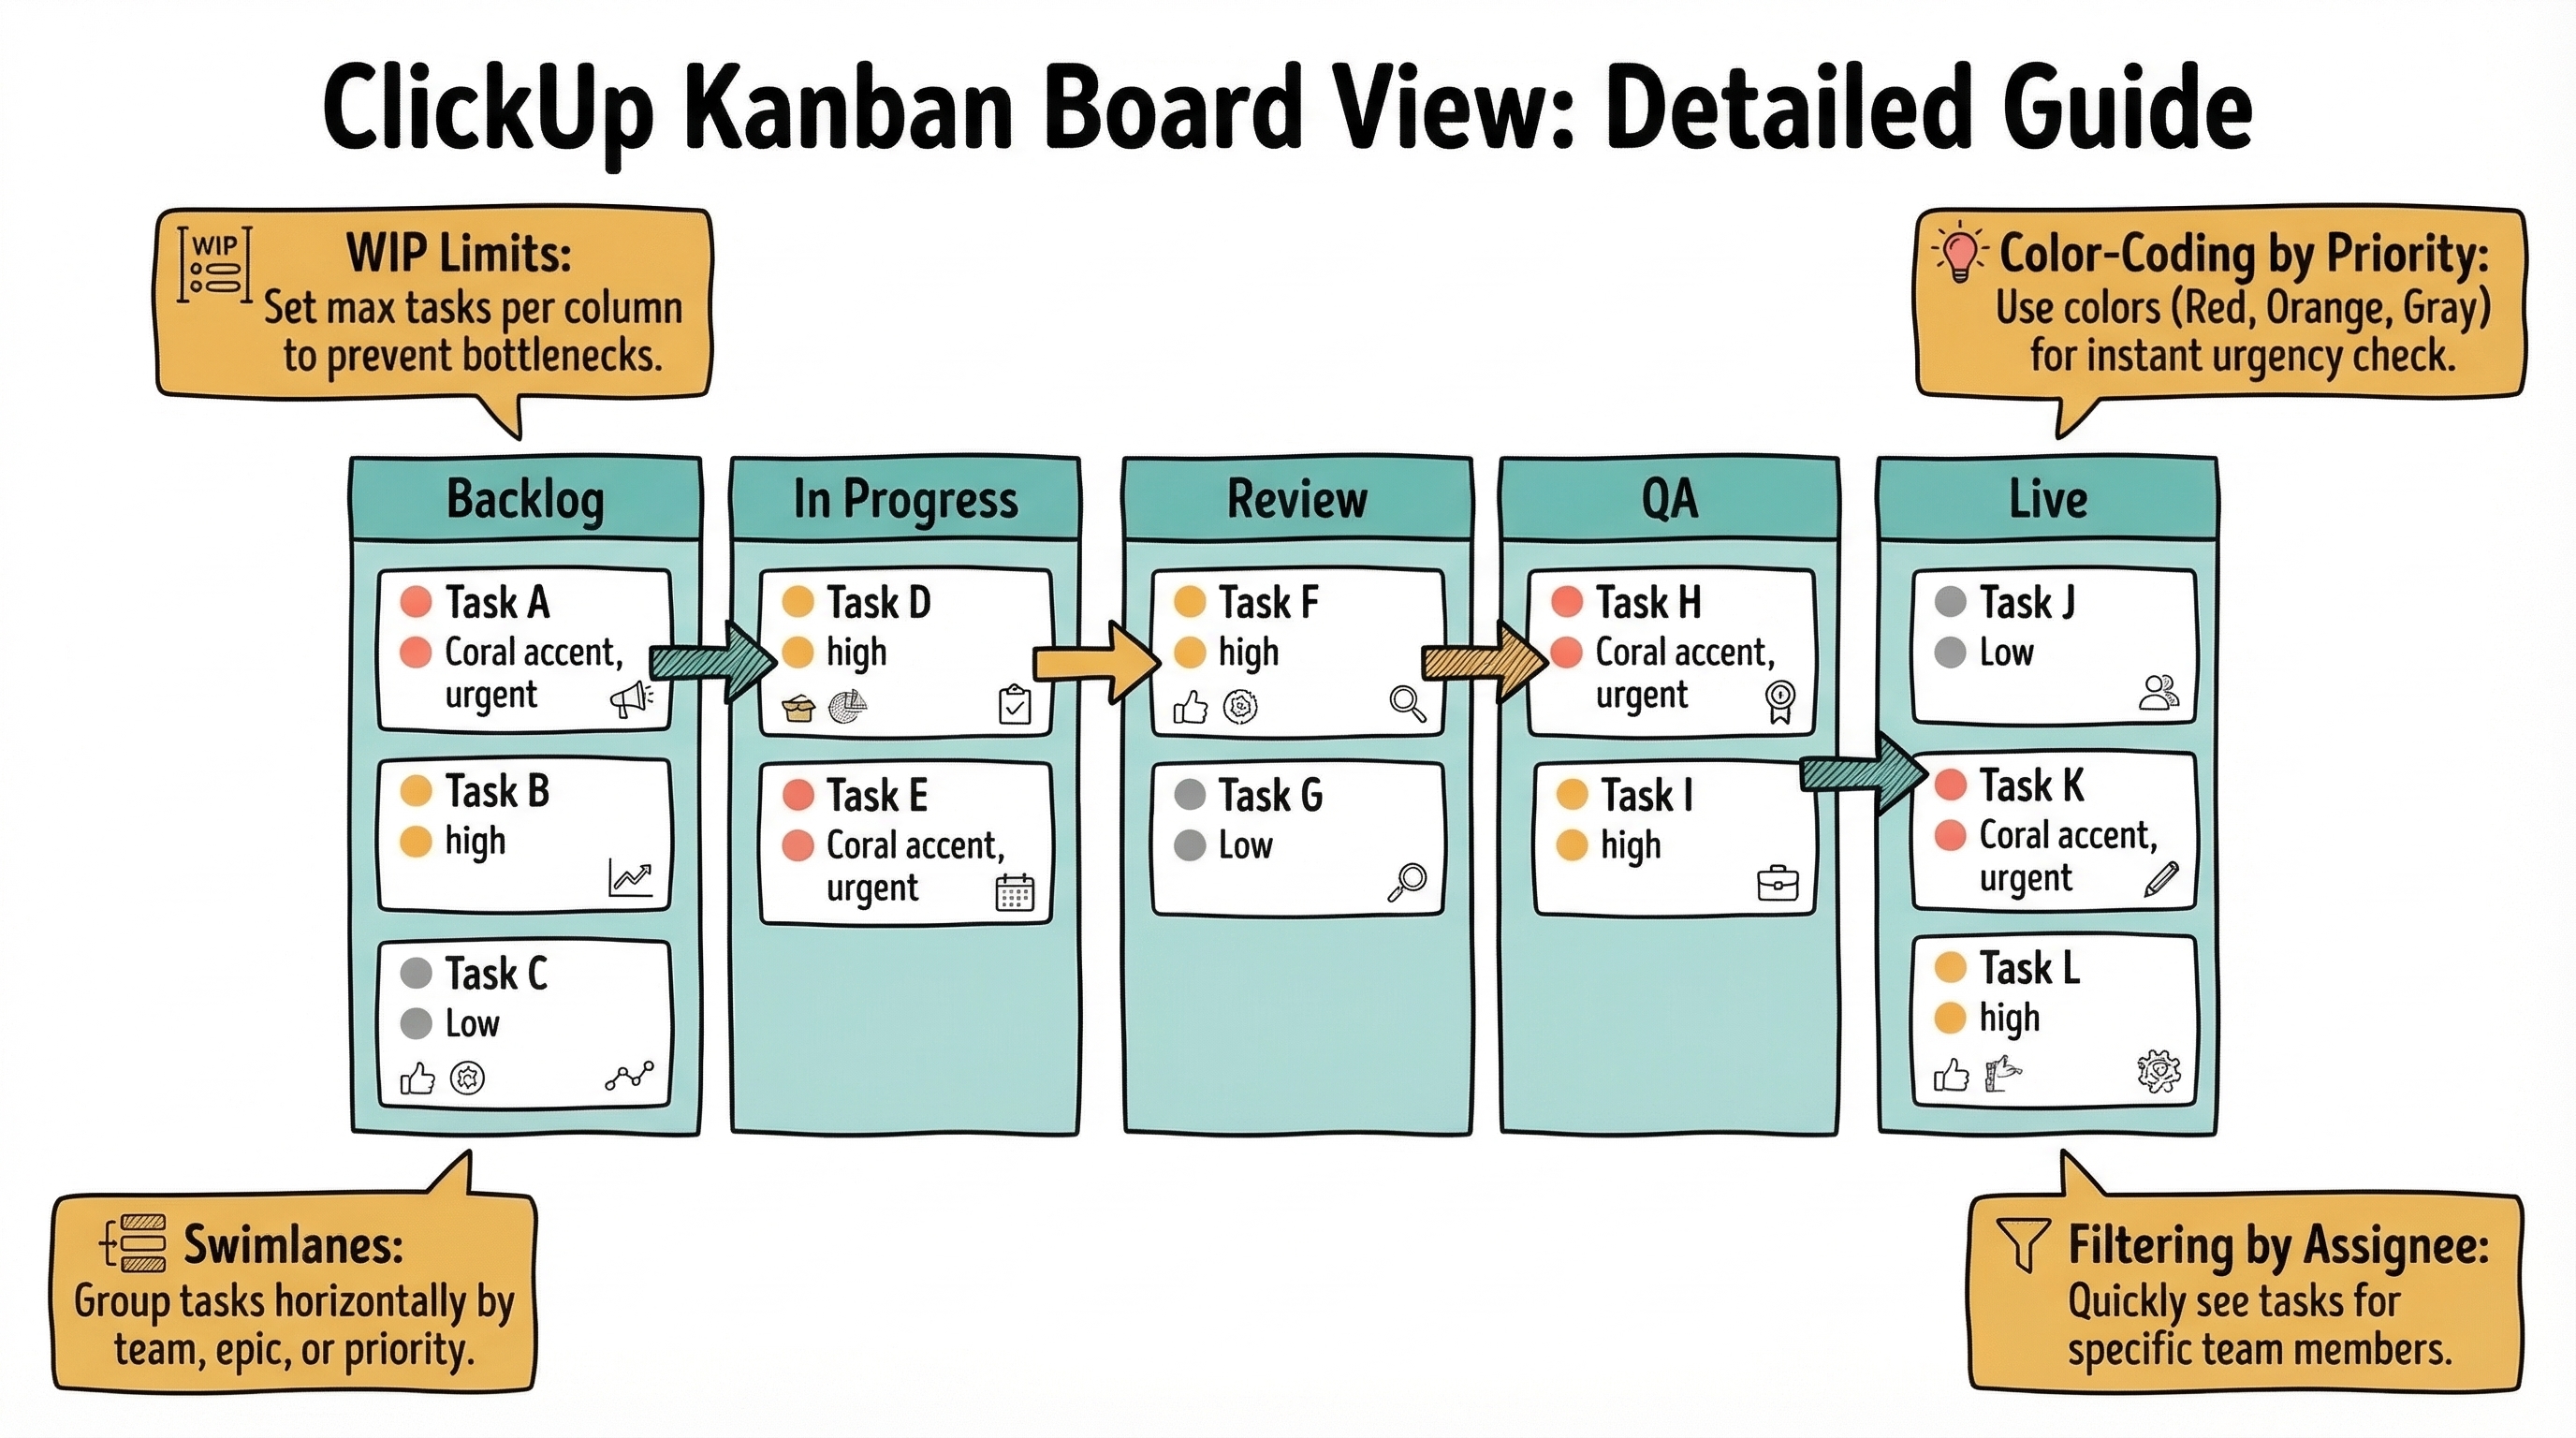
Kanban Board View — Detailed
Full breakdown of the Board view: 5 status columns, priority dots, WIP limits, swimlanes, and filtering by assignee.
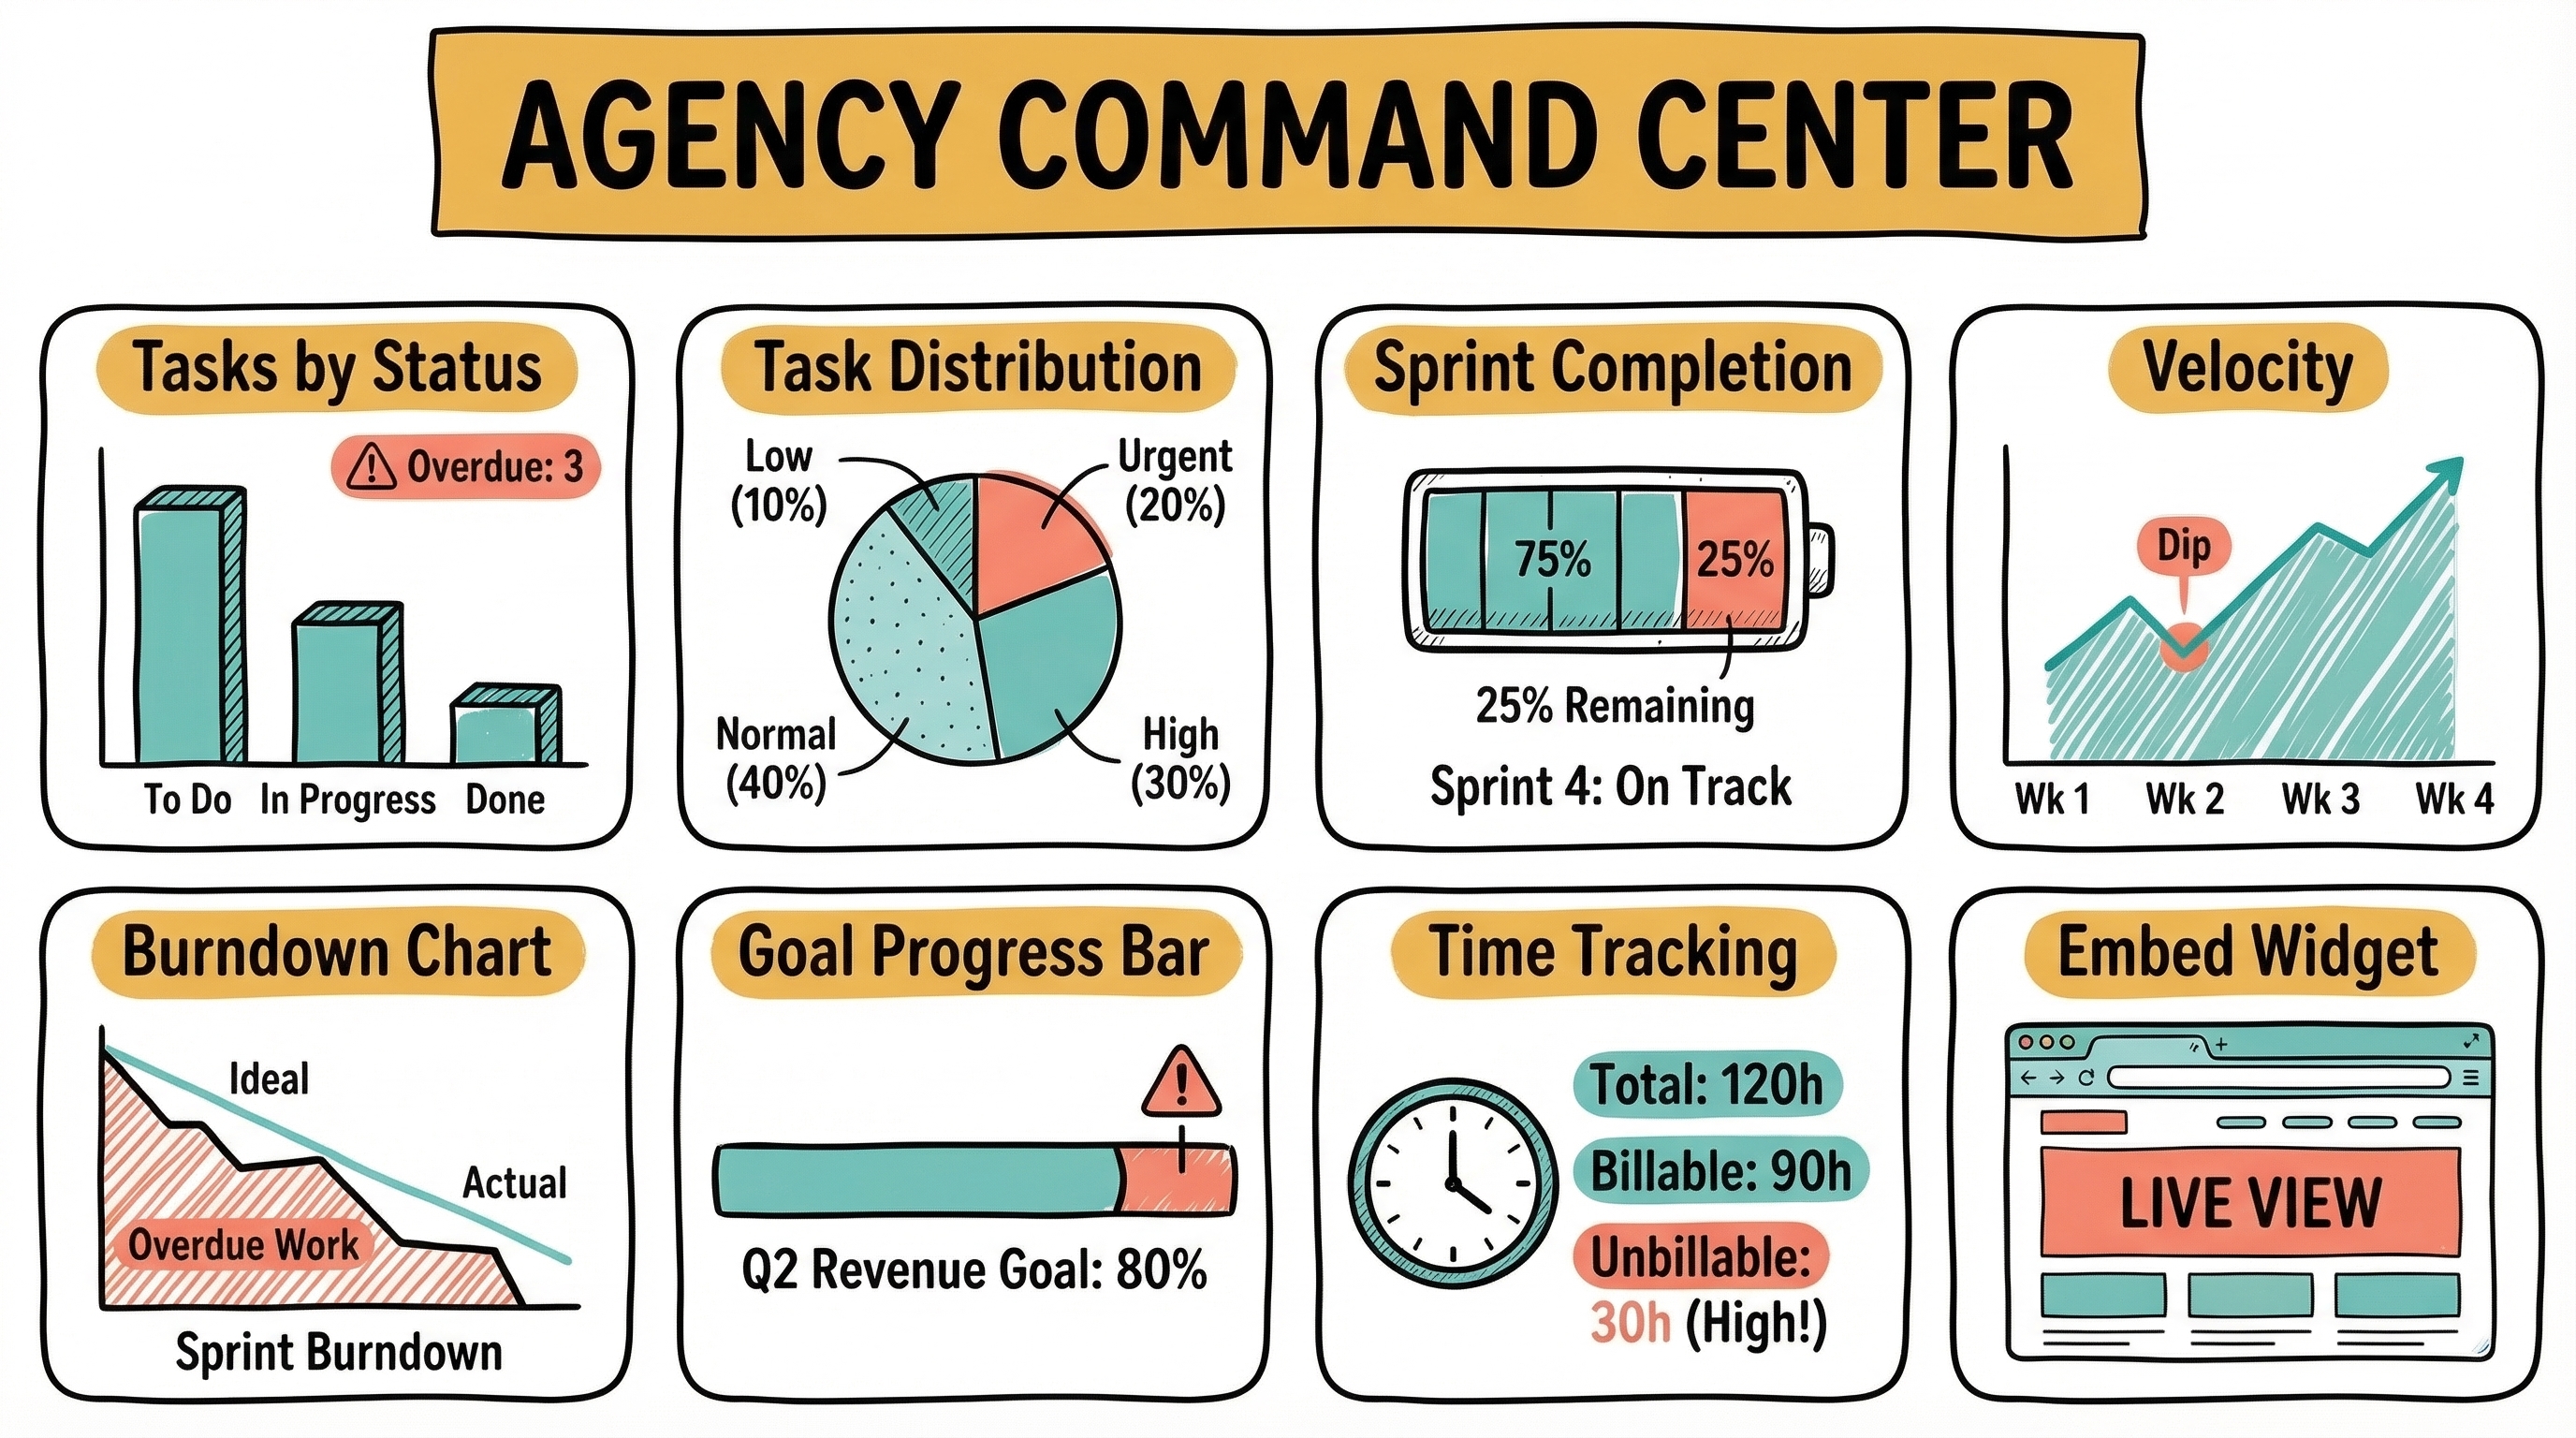
Agency Command Center — Dashboard Widgets
8 dashboard widgets: bar chart, pie chart, battery, velocity, burndown, goals, time tracking, and embed. Your agency KPI cockpit.
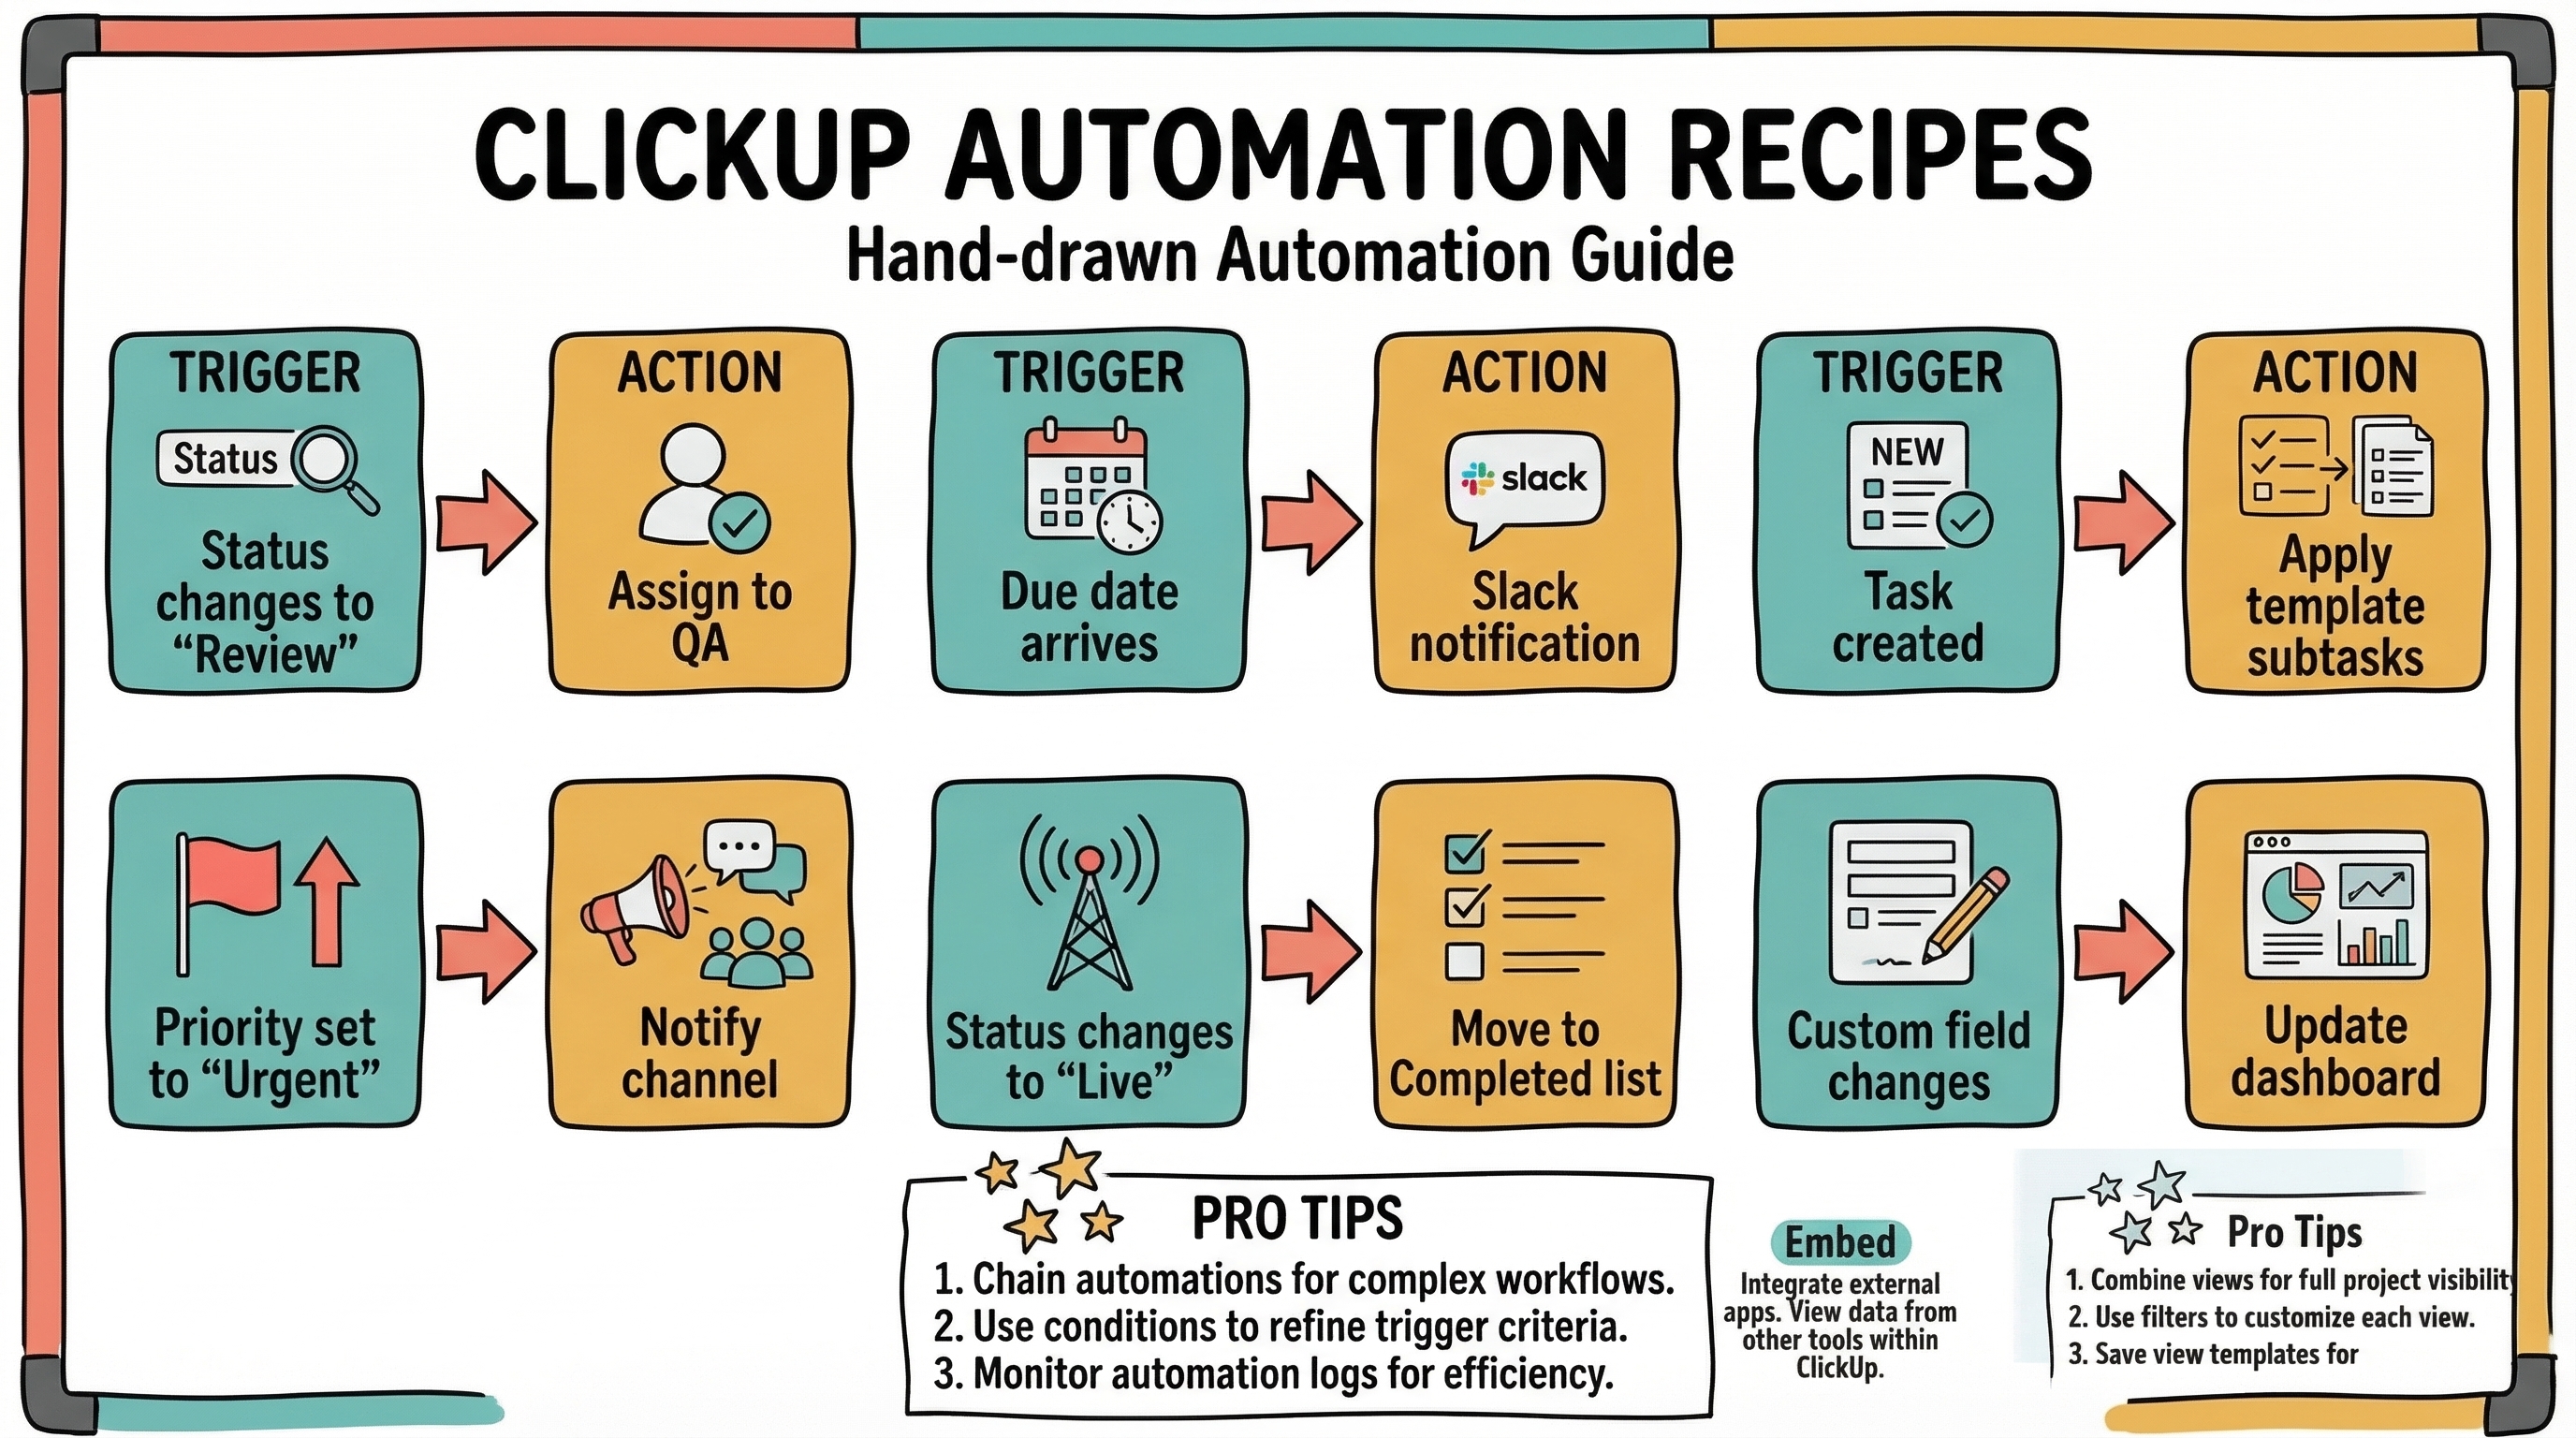
Automation Recipes
6 trigger-action automation pairs: status changes, due dates, task creation, priority alerts, completion moves, and custom field updates.
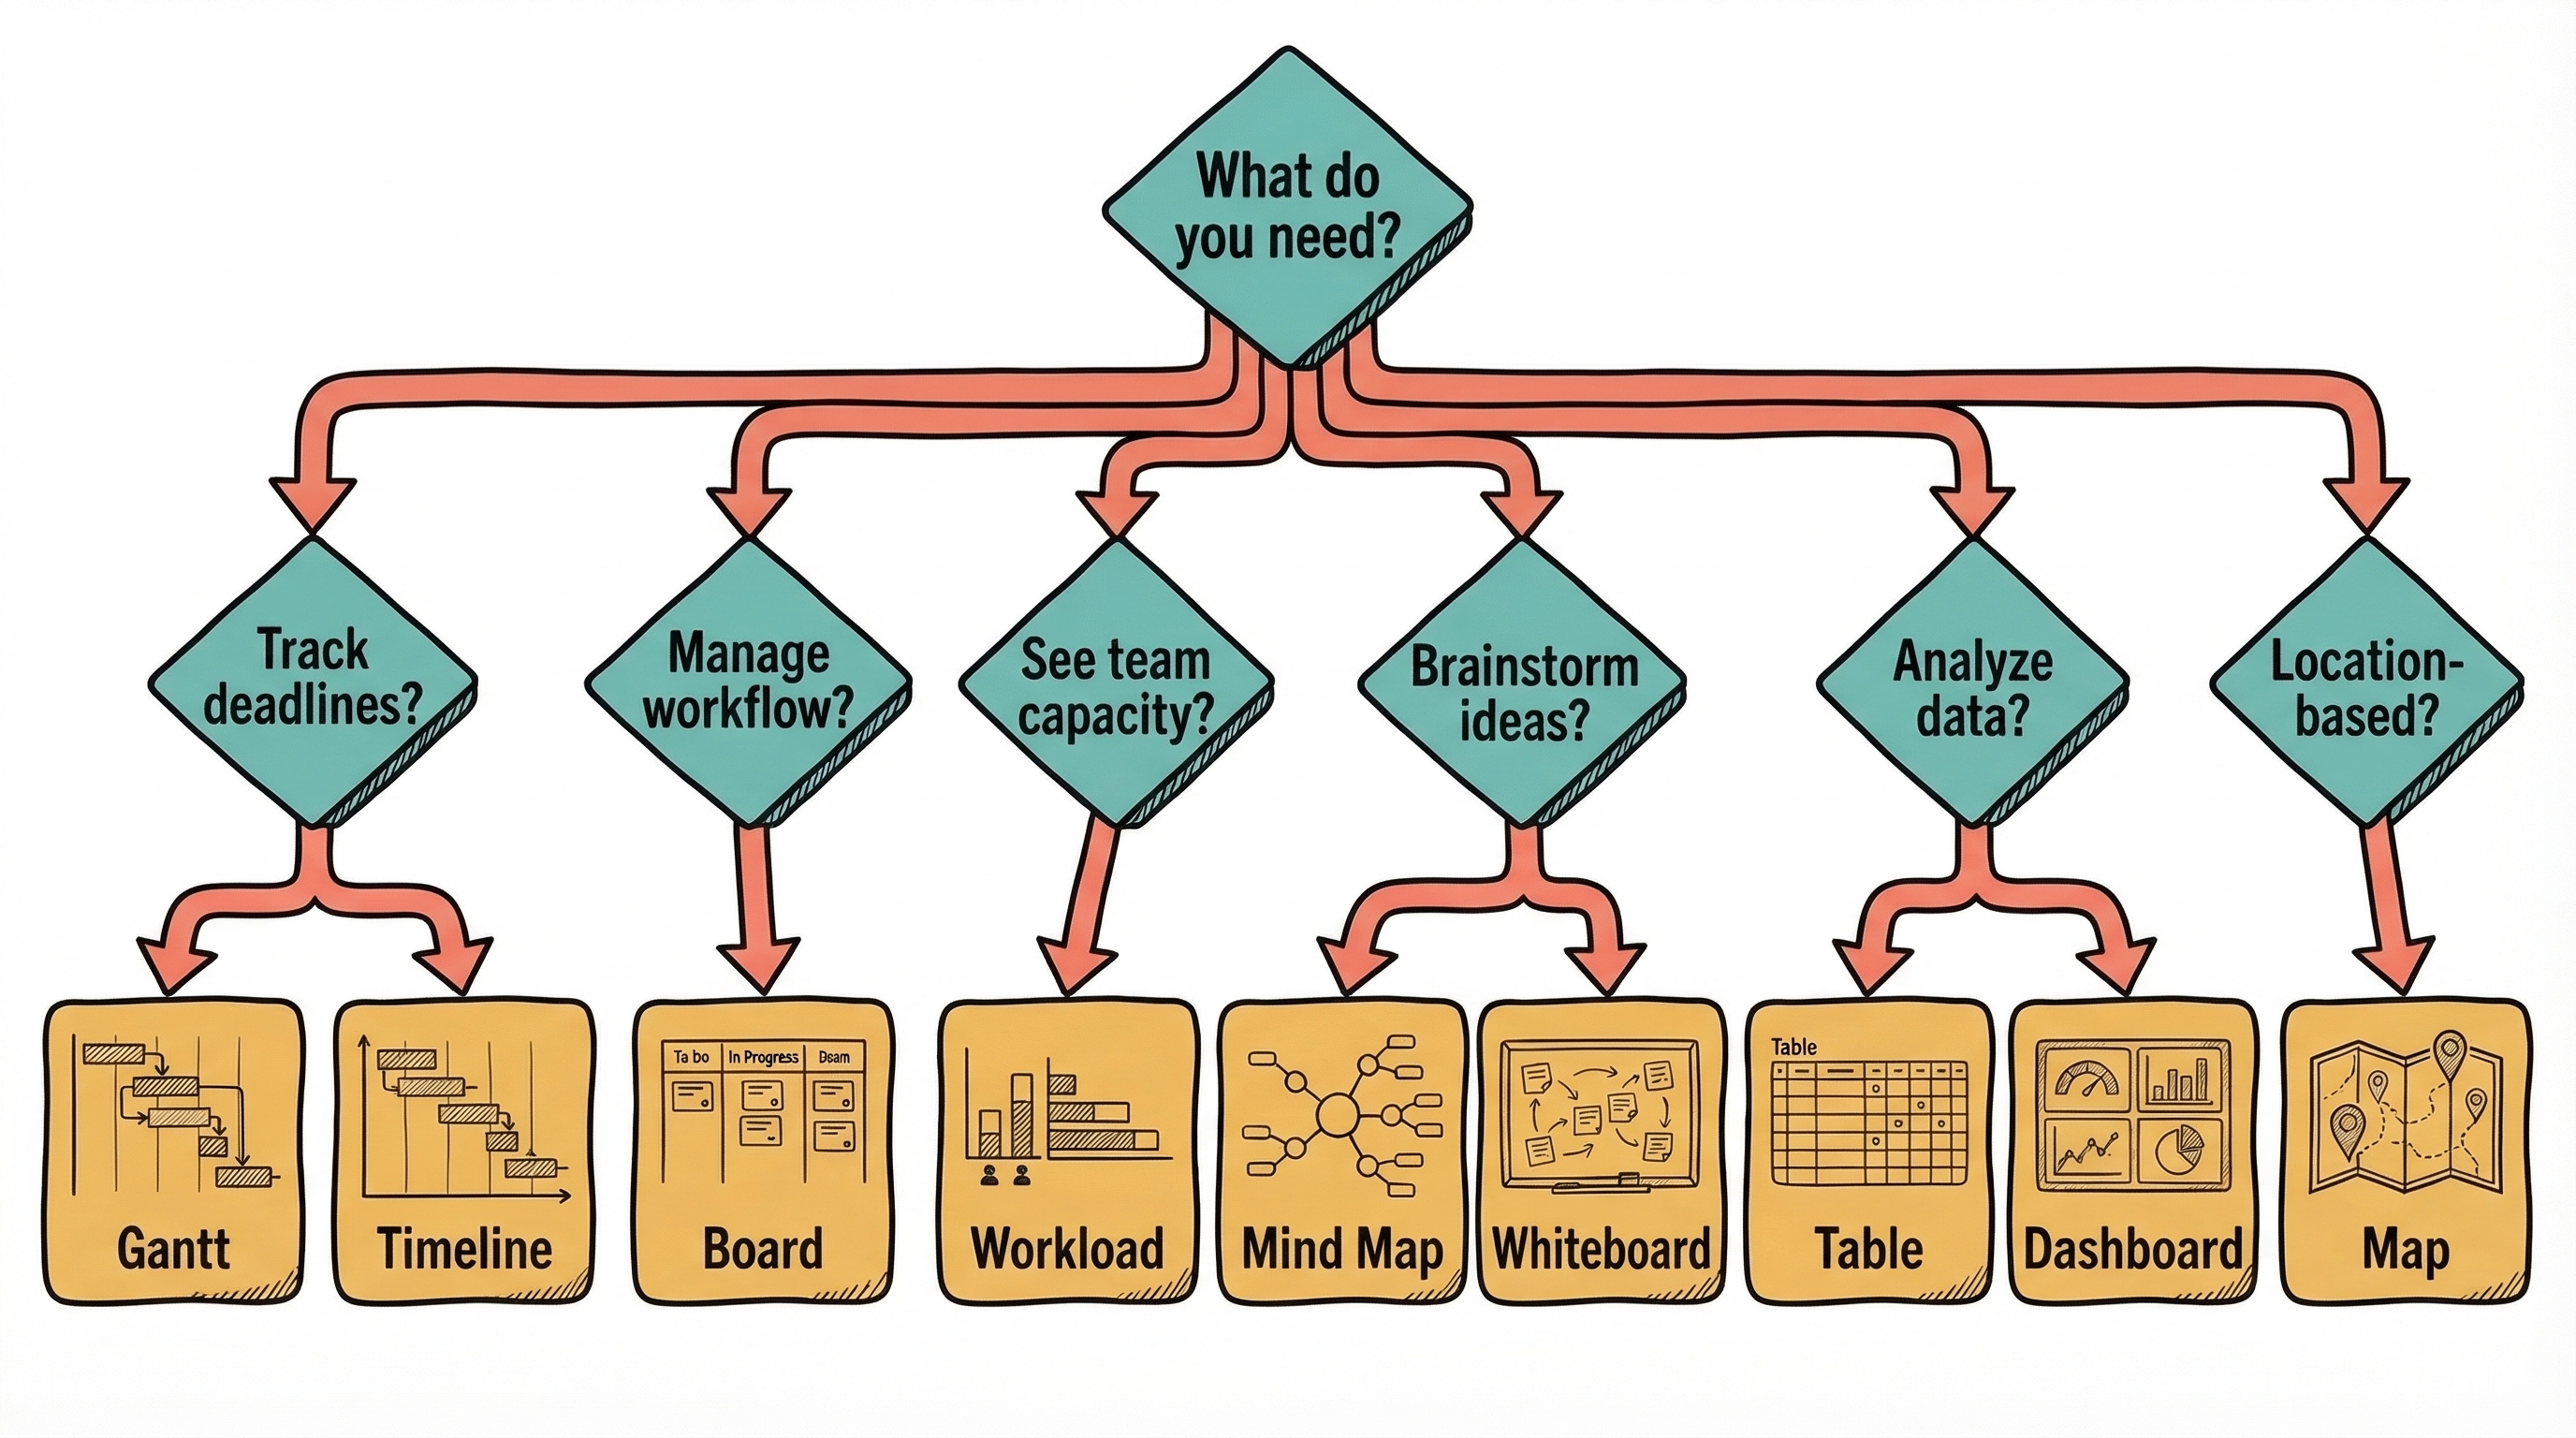
Which View Do I Need? — Decision Tree
Start with "What do you need?" and follow the branches: deadlines, workflow, capacity, brainstorming, data, or location — each leads to the right view.
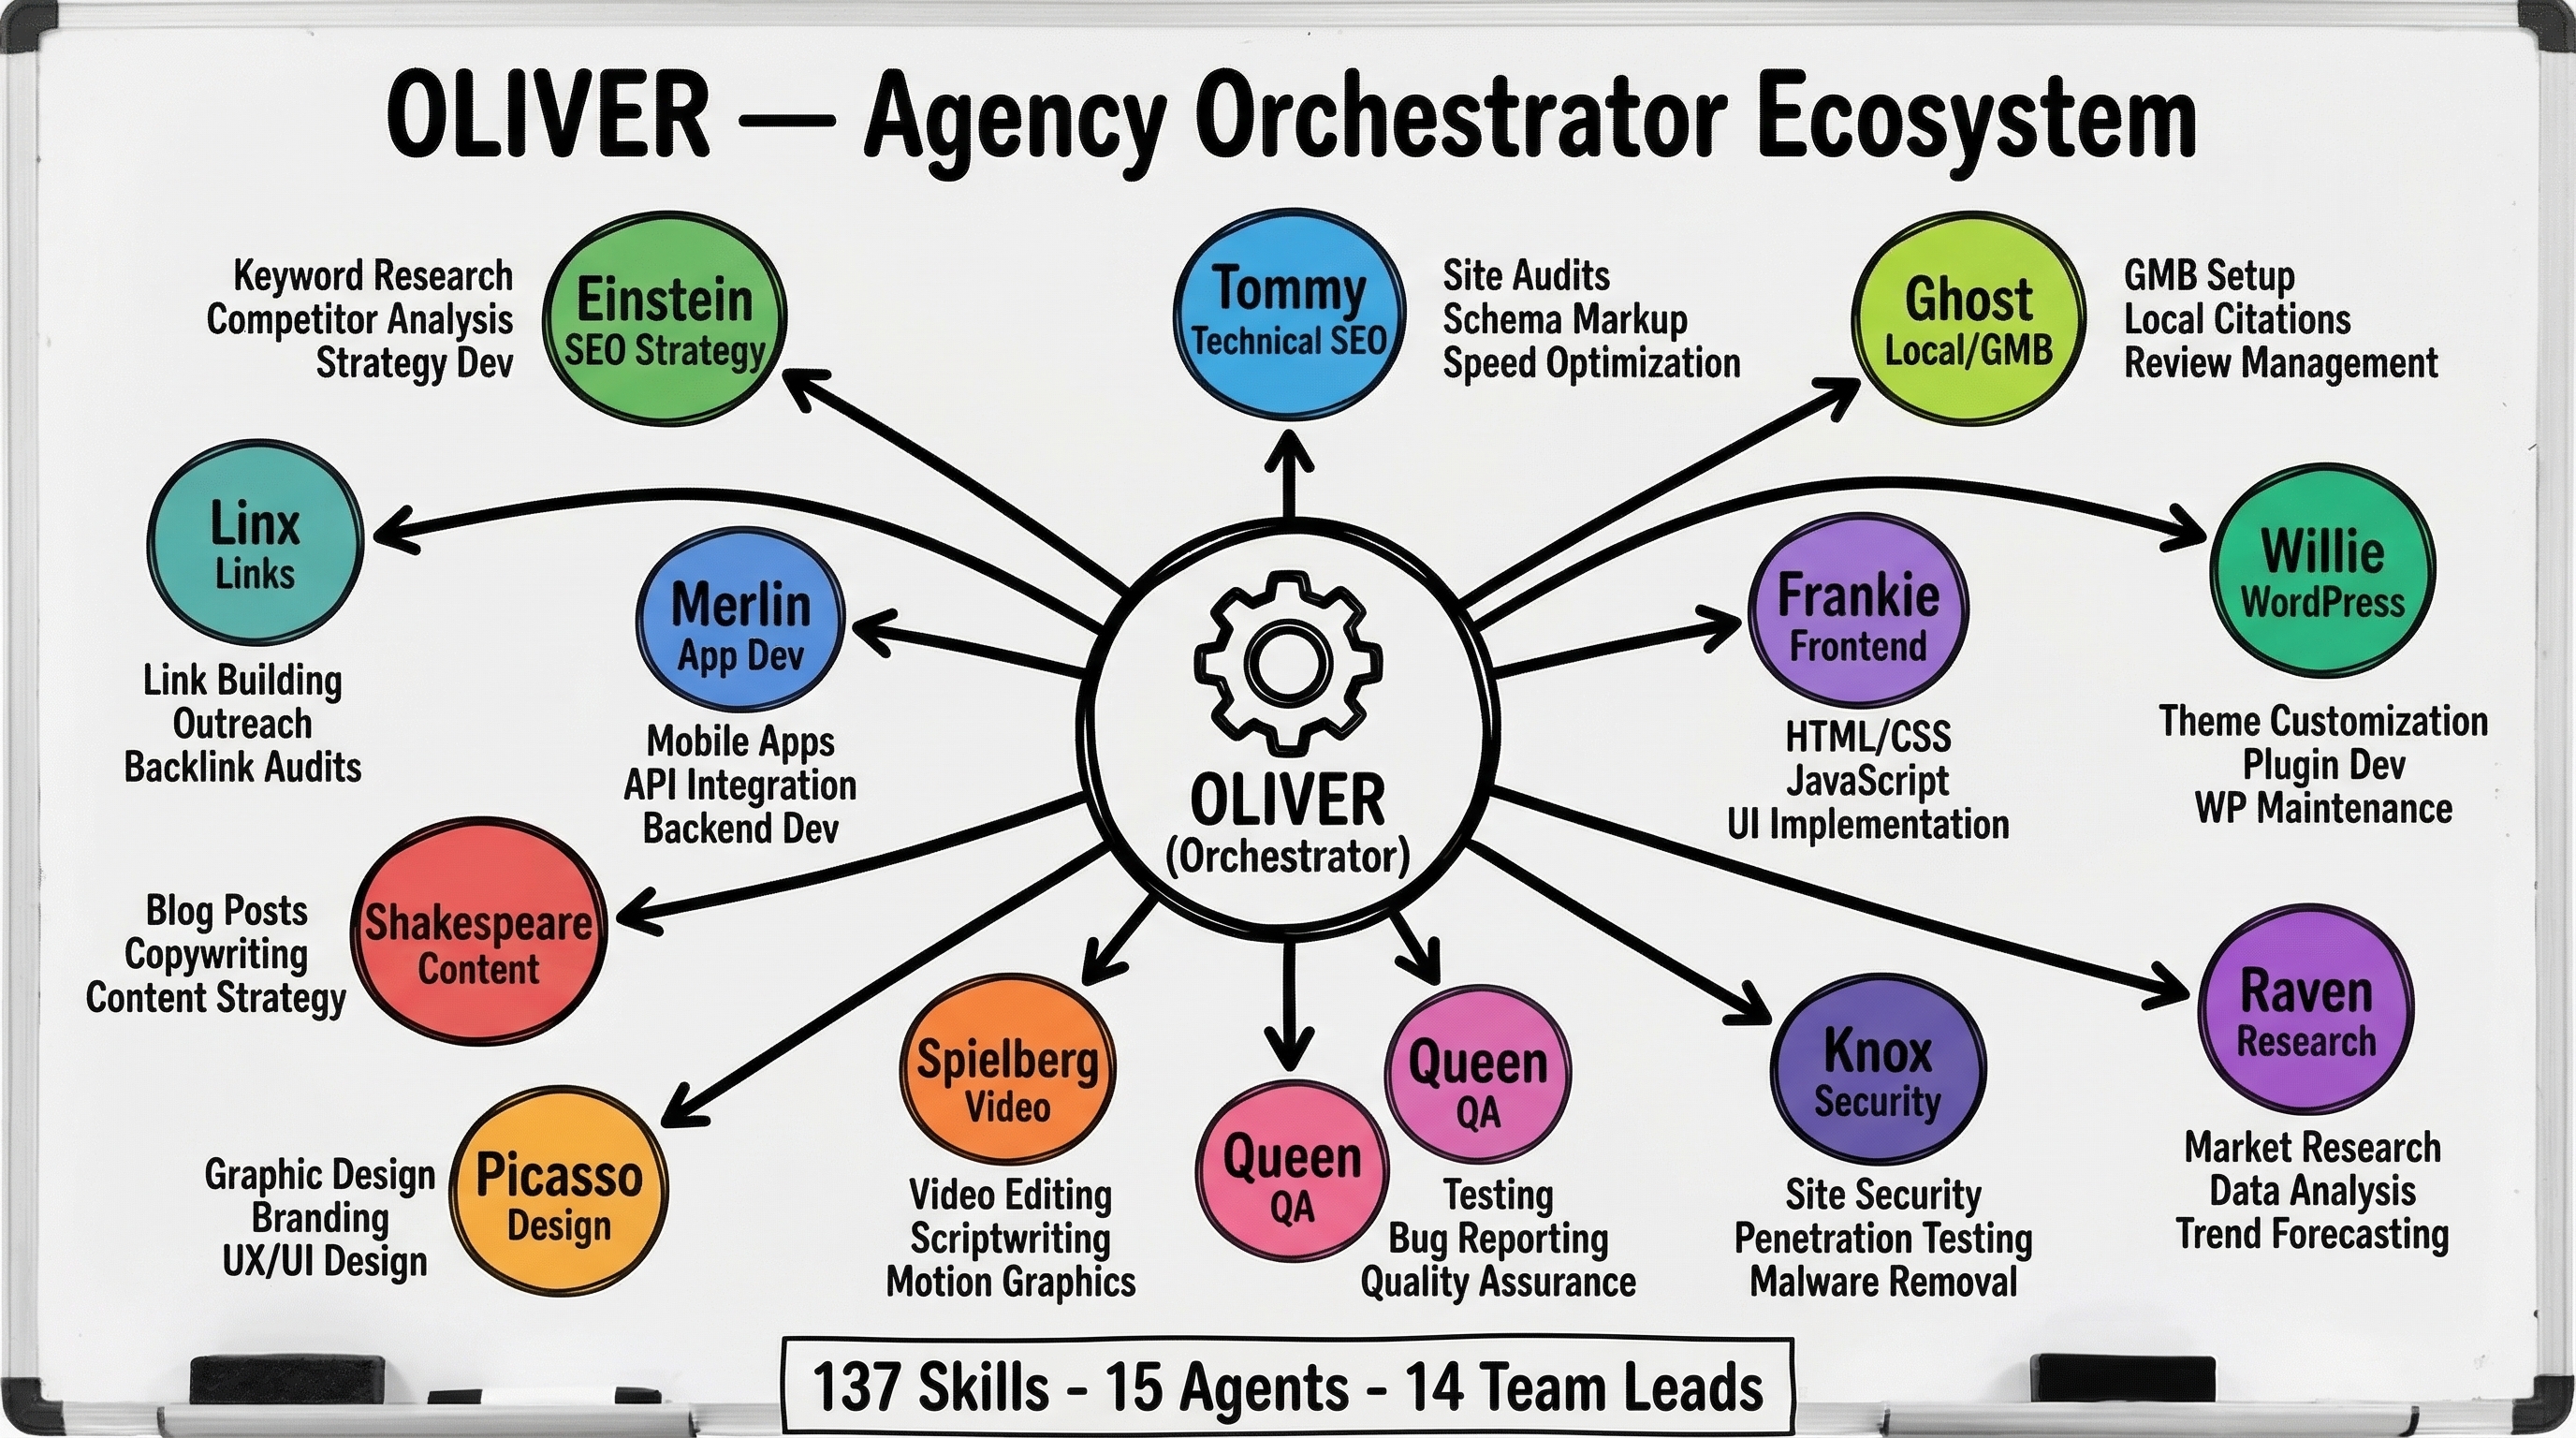
Oliver — Agency Orchestrator Ecosystem
Hub-spoke map of the full Oliver ecosystem: 14 color-coded team leads radiating from the central orchestrator, with example skills for each.
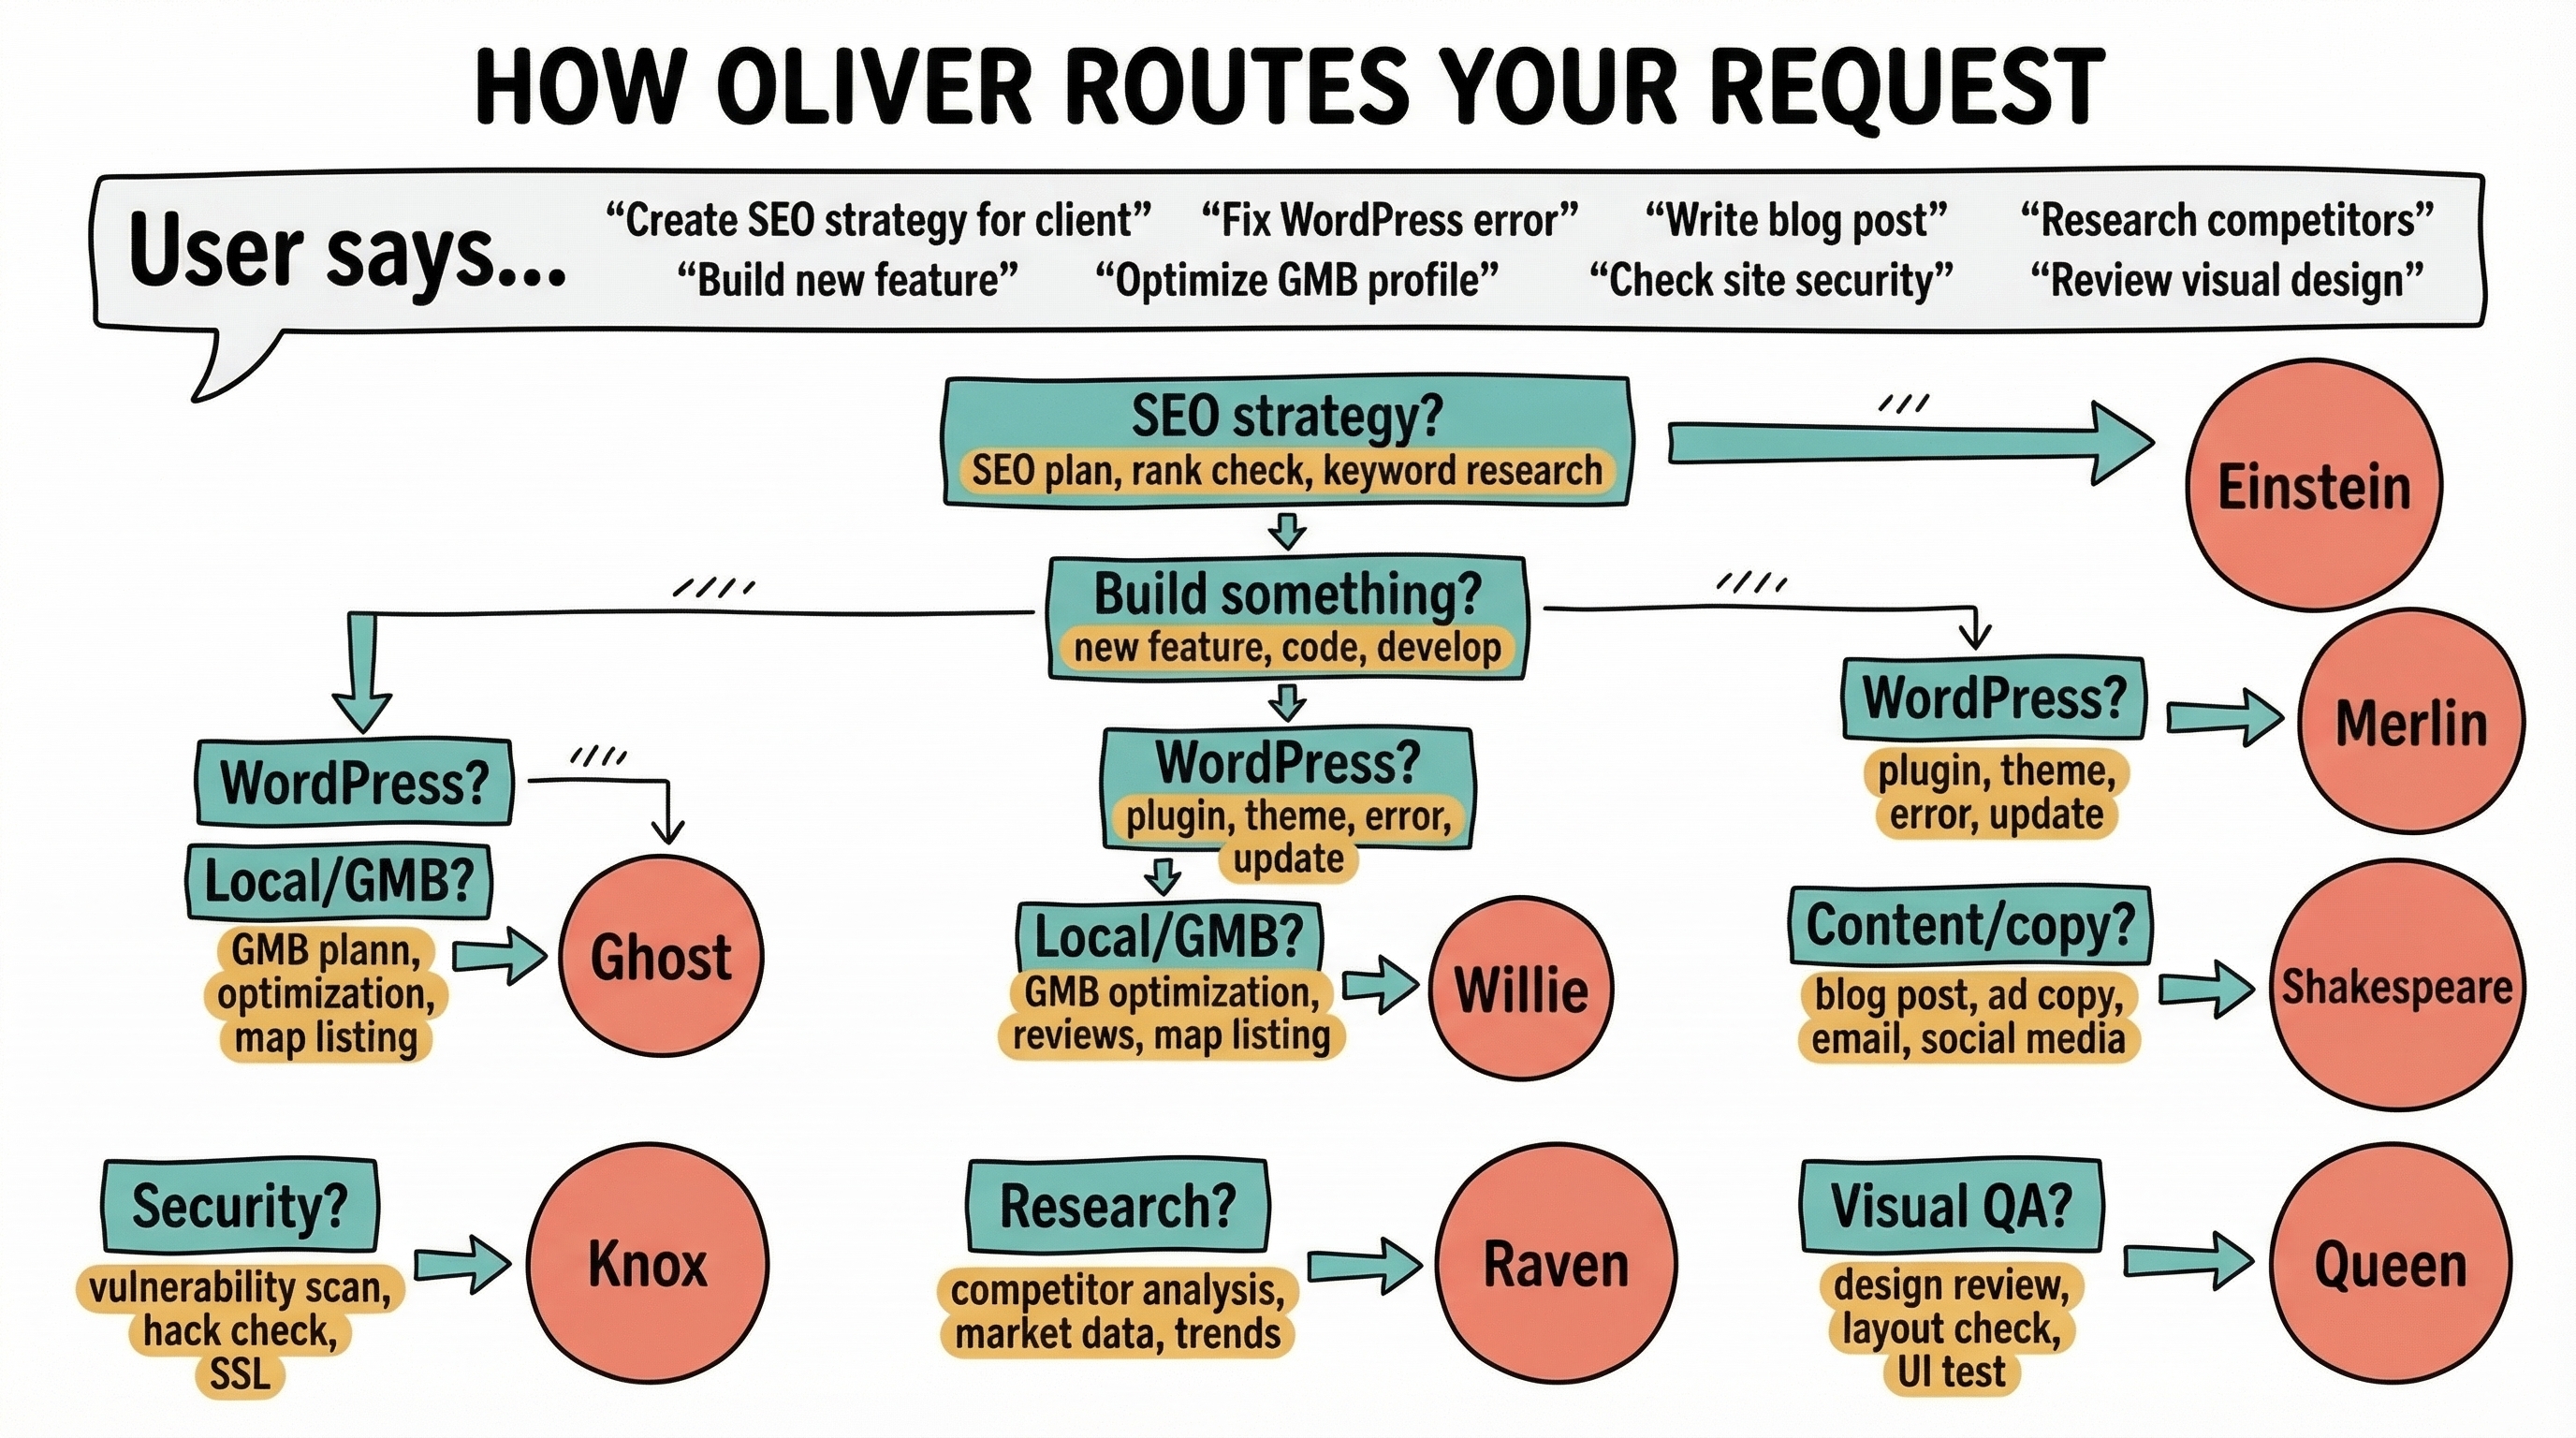
How Oliver Routes Your Request
Decision flowchart showing how user requests get routed to the right team lead based on trigger keywords.
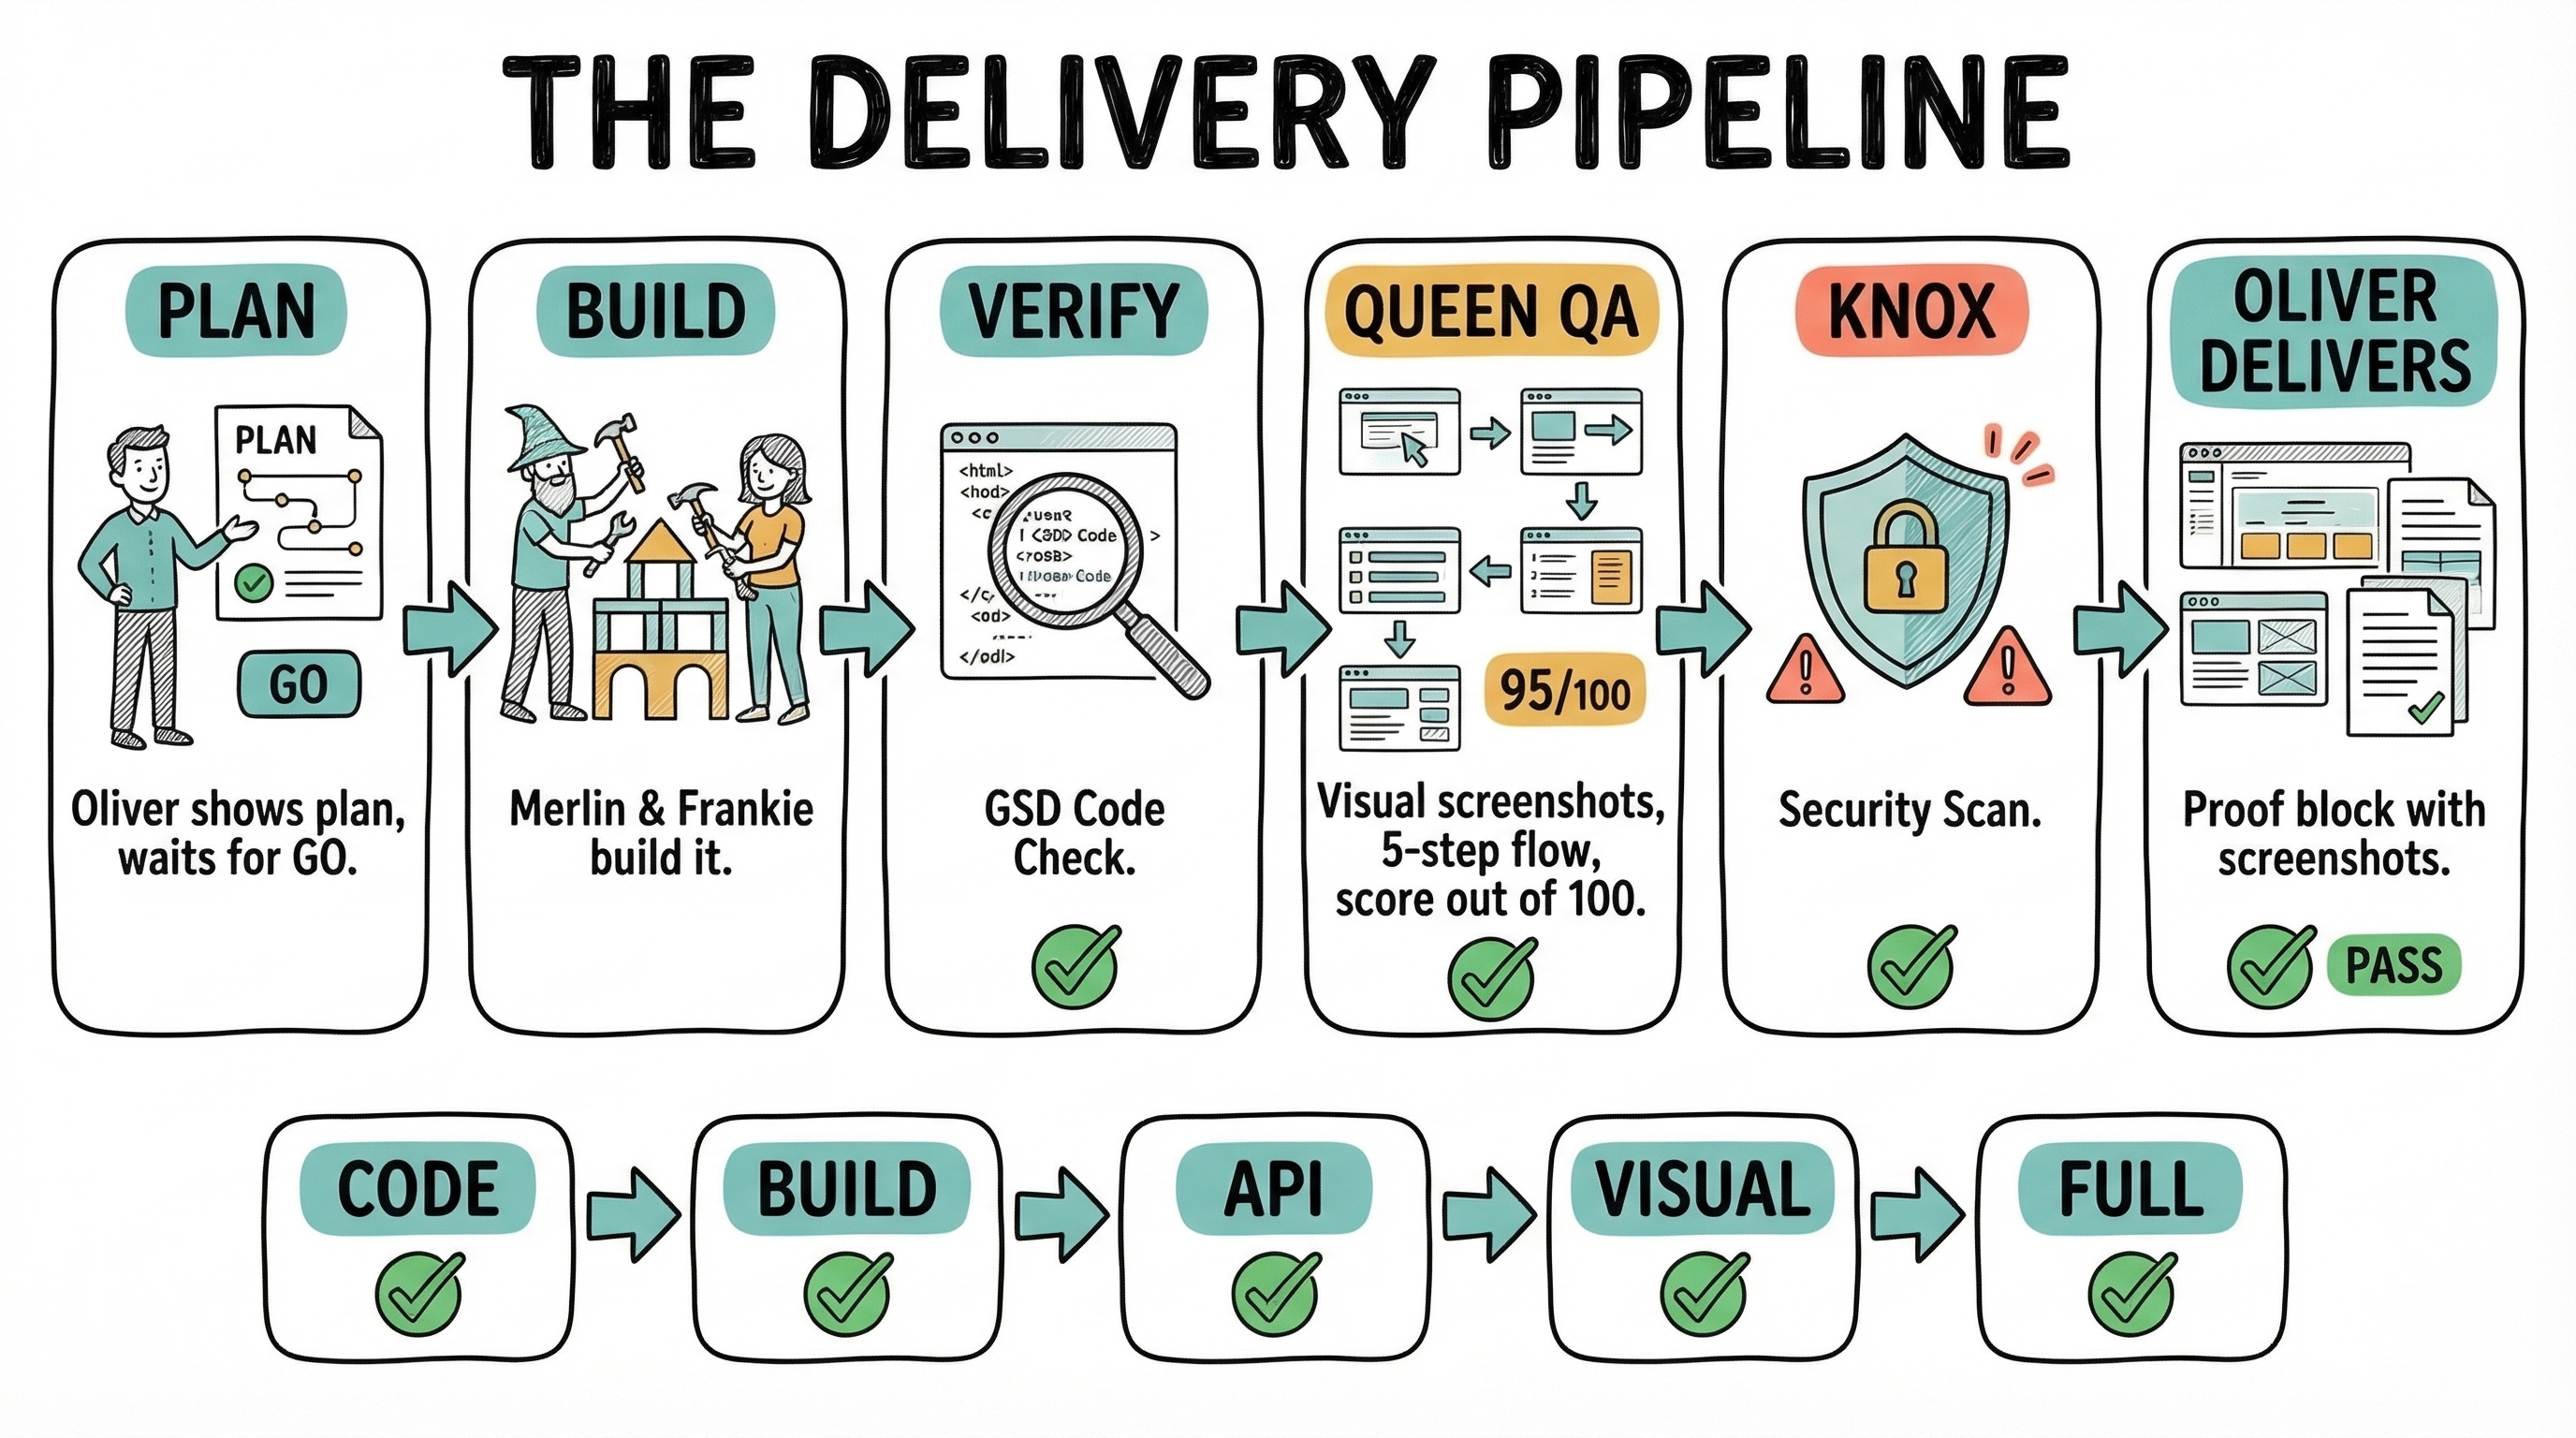
The Delivery Pipeline
Plan → Build → Verify → Queen QA → Knox Security → Oliver Delivers. Plus the 5 verification levels: CODE → BUILD → API → VISUAL → FULL.
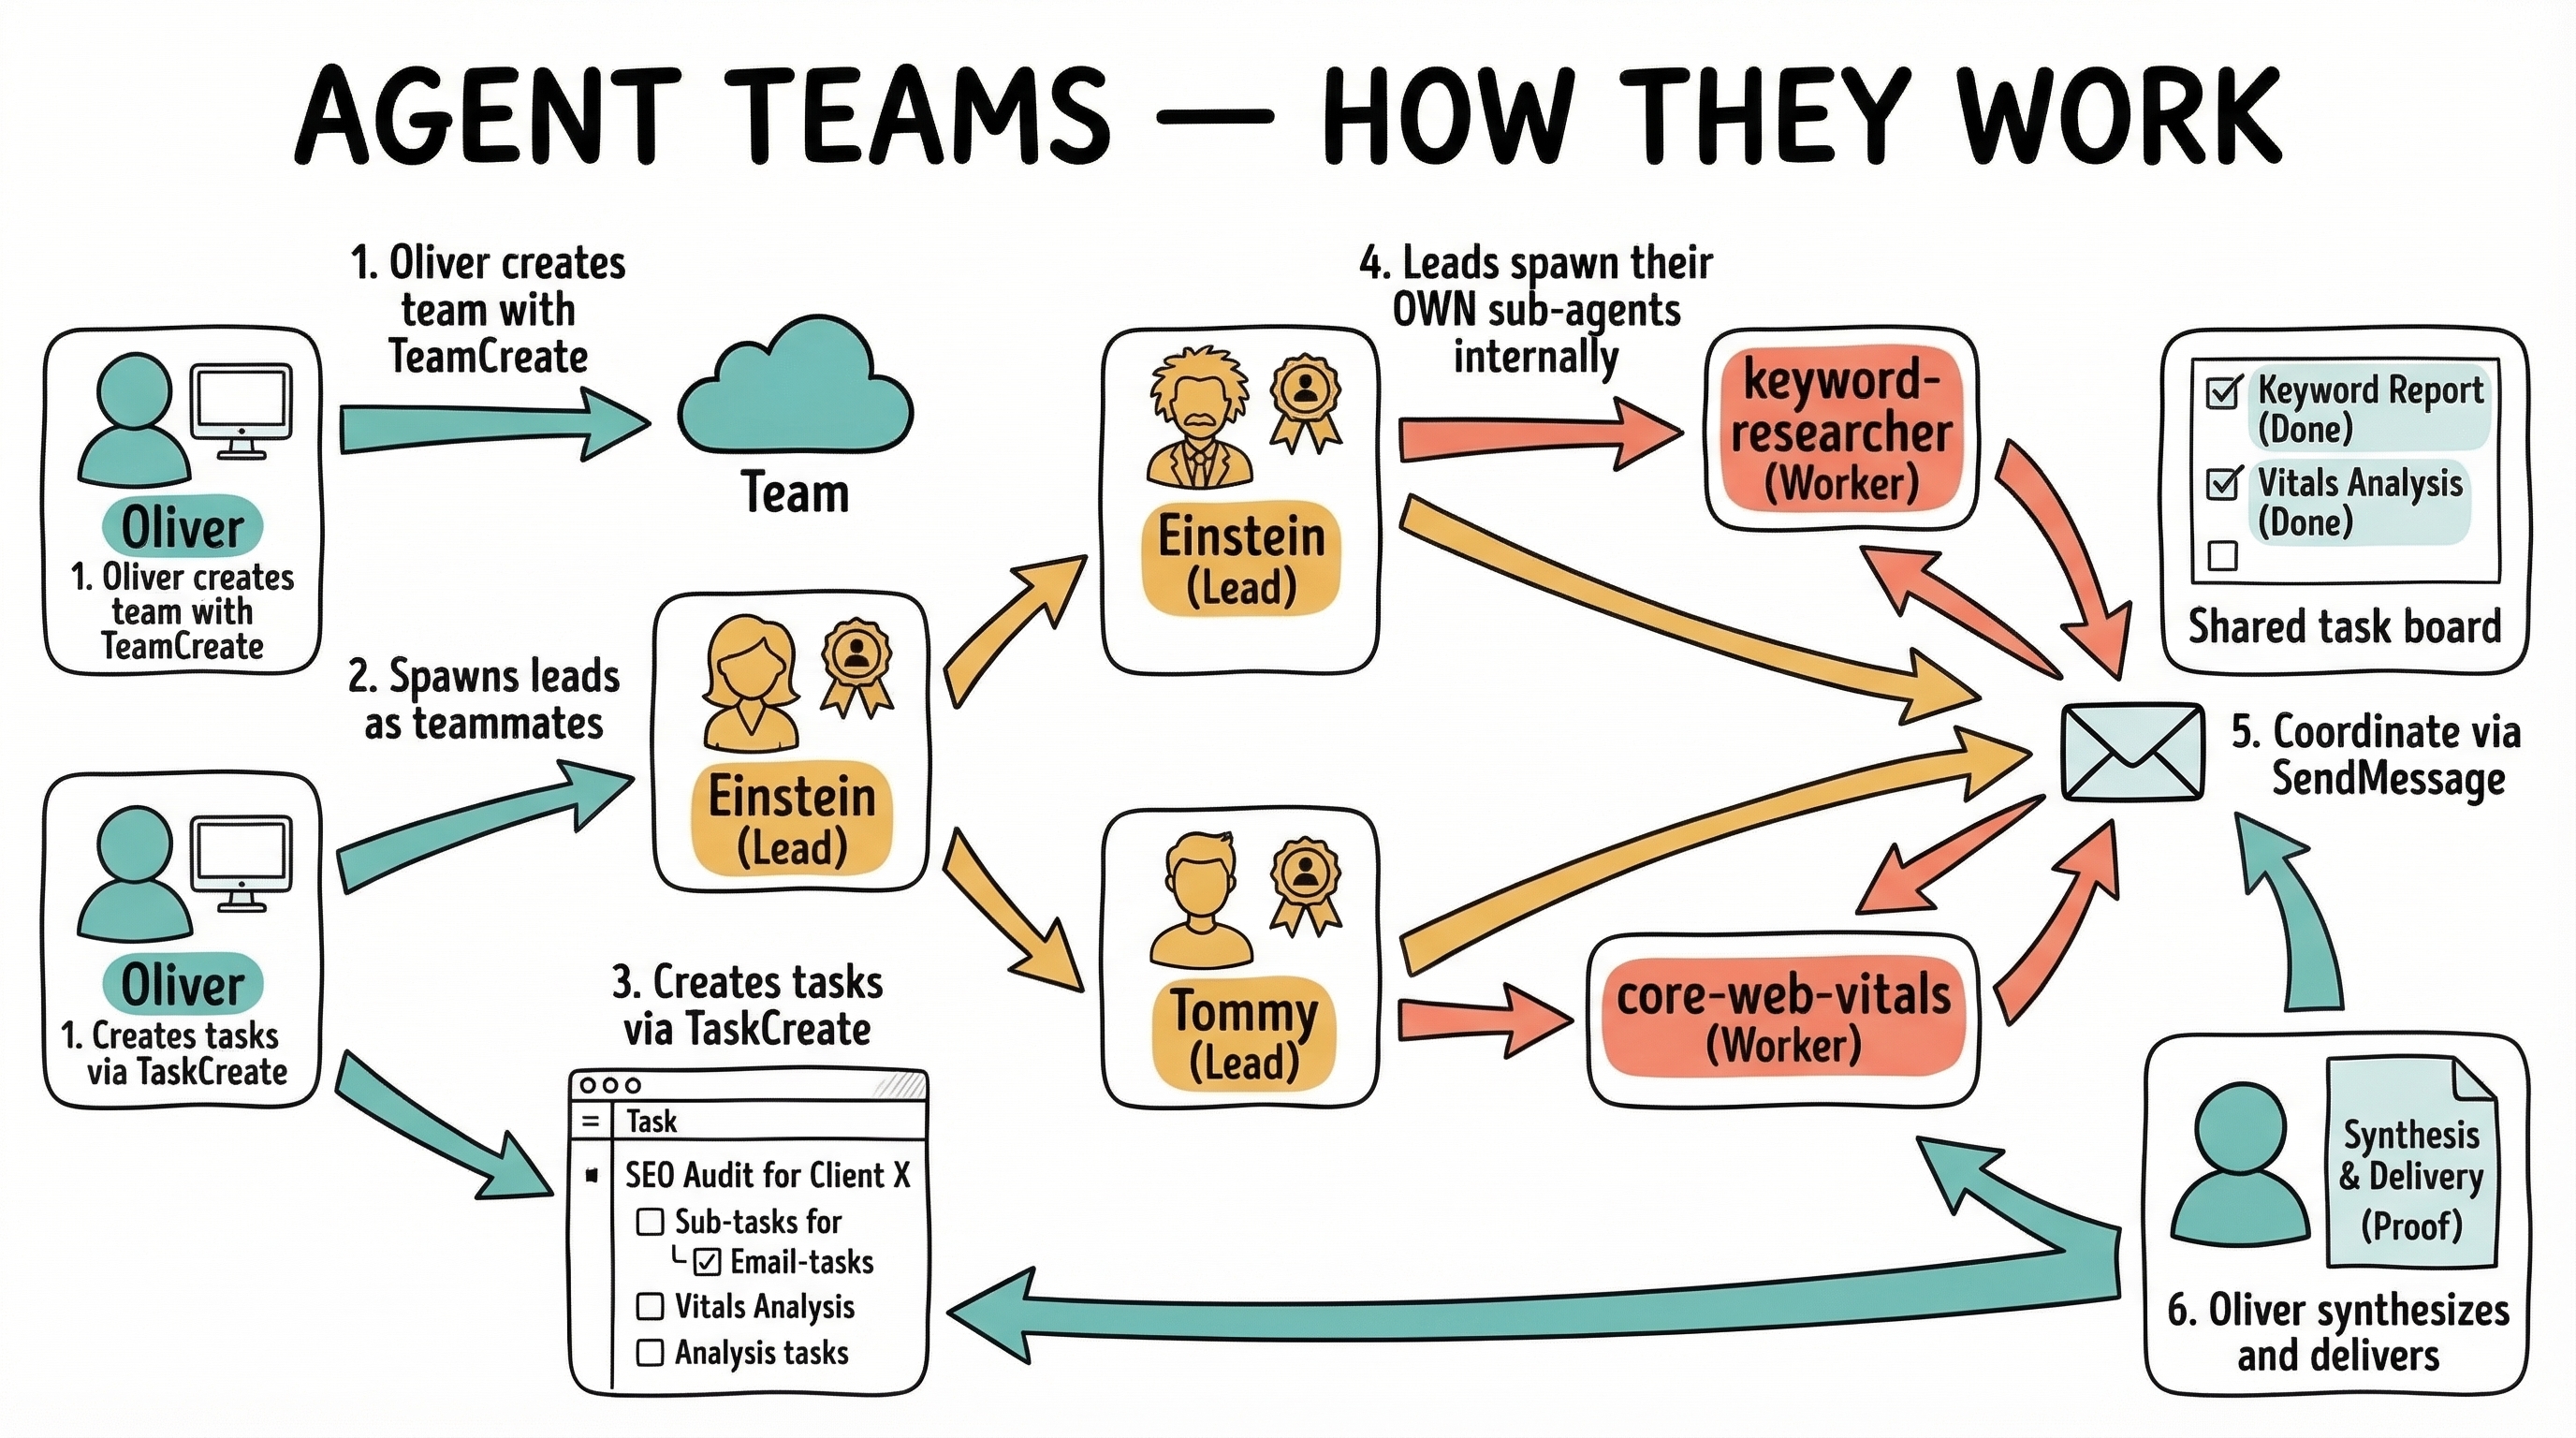
Agent Teams — How They Work
The 6-step Teams workflow with a real example: SEO Audit for Client X. Oliver spawns leads, leads spawn workers, coordinate via SendMessage.
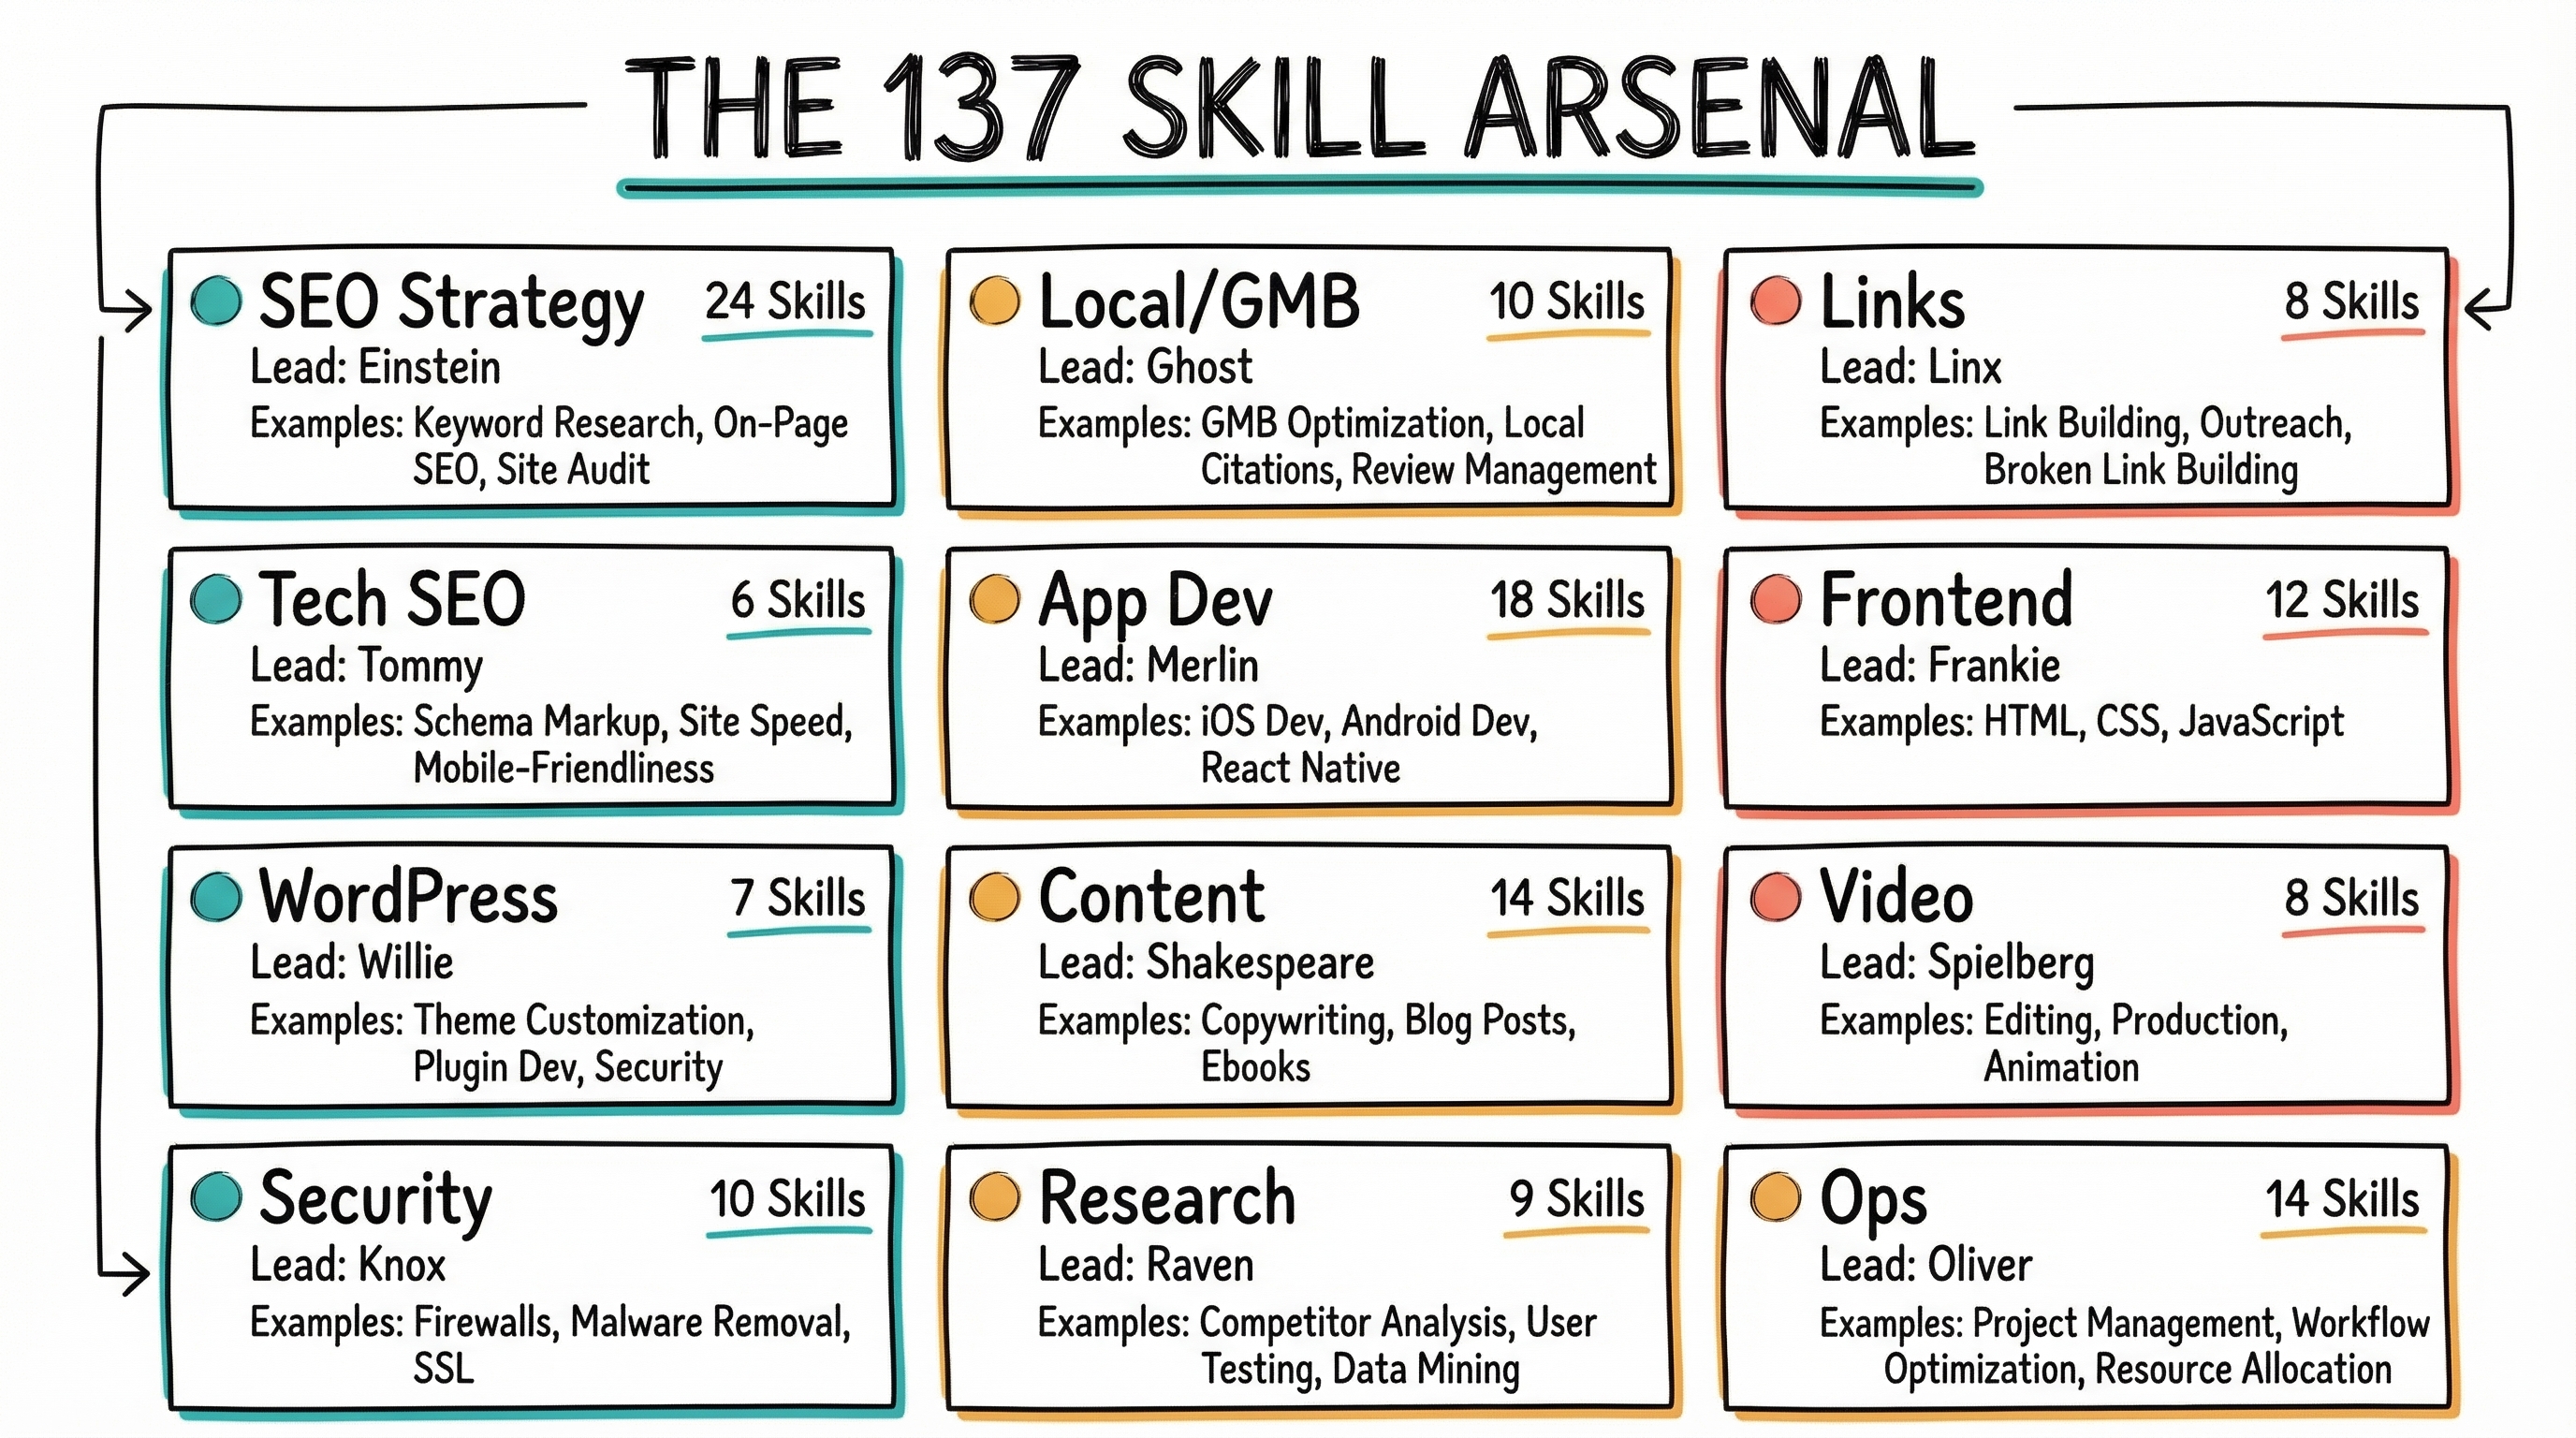
The 137 Skill Arsenal
All 14 skill categories with lead names, skill counts, and examples. The complete arsenal at a glance.
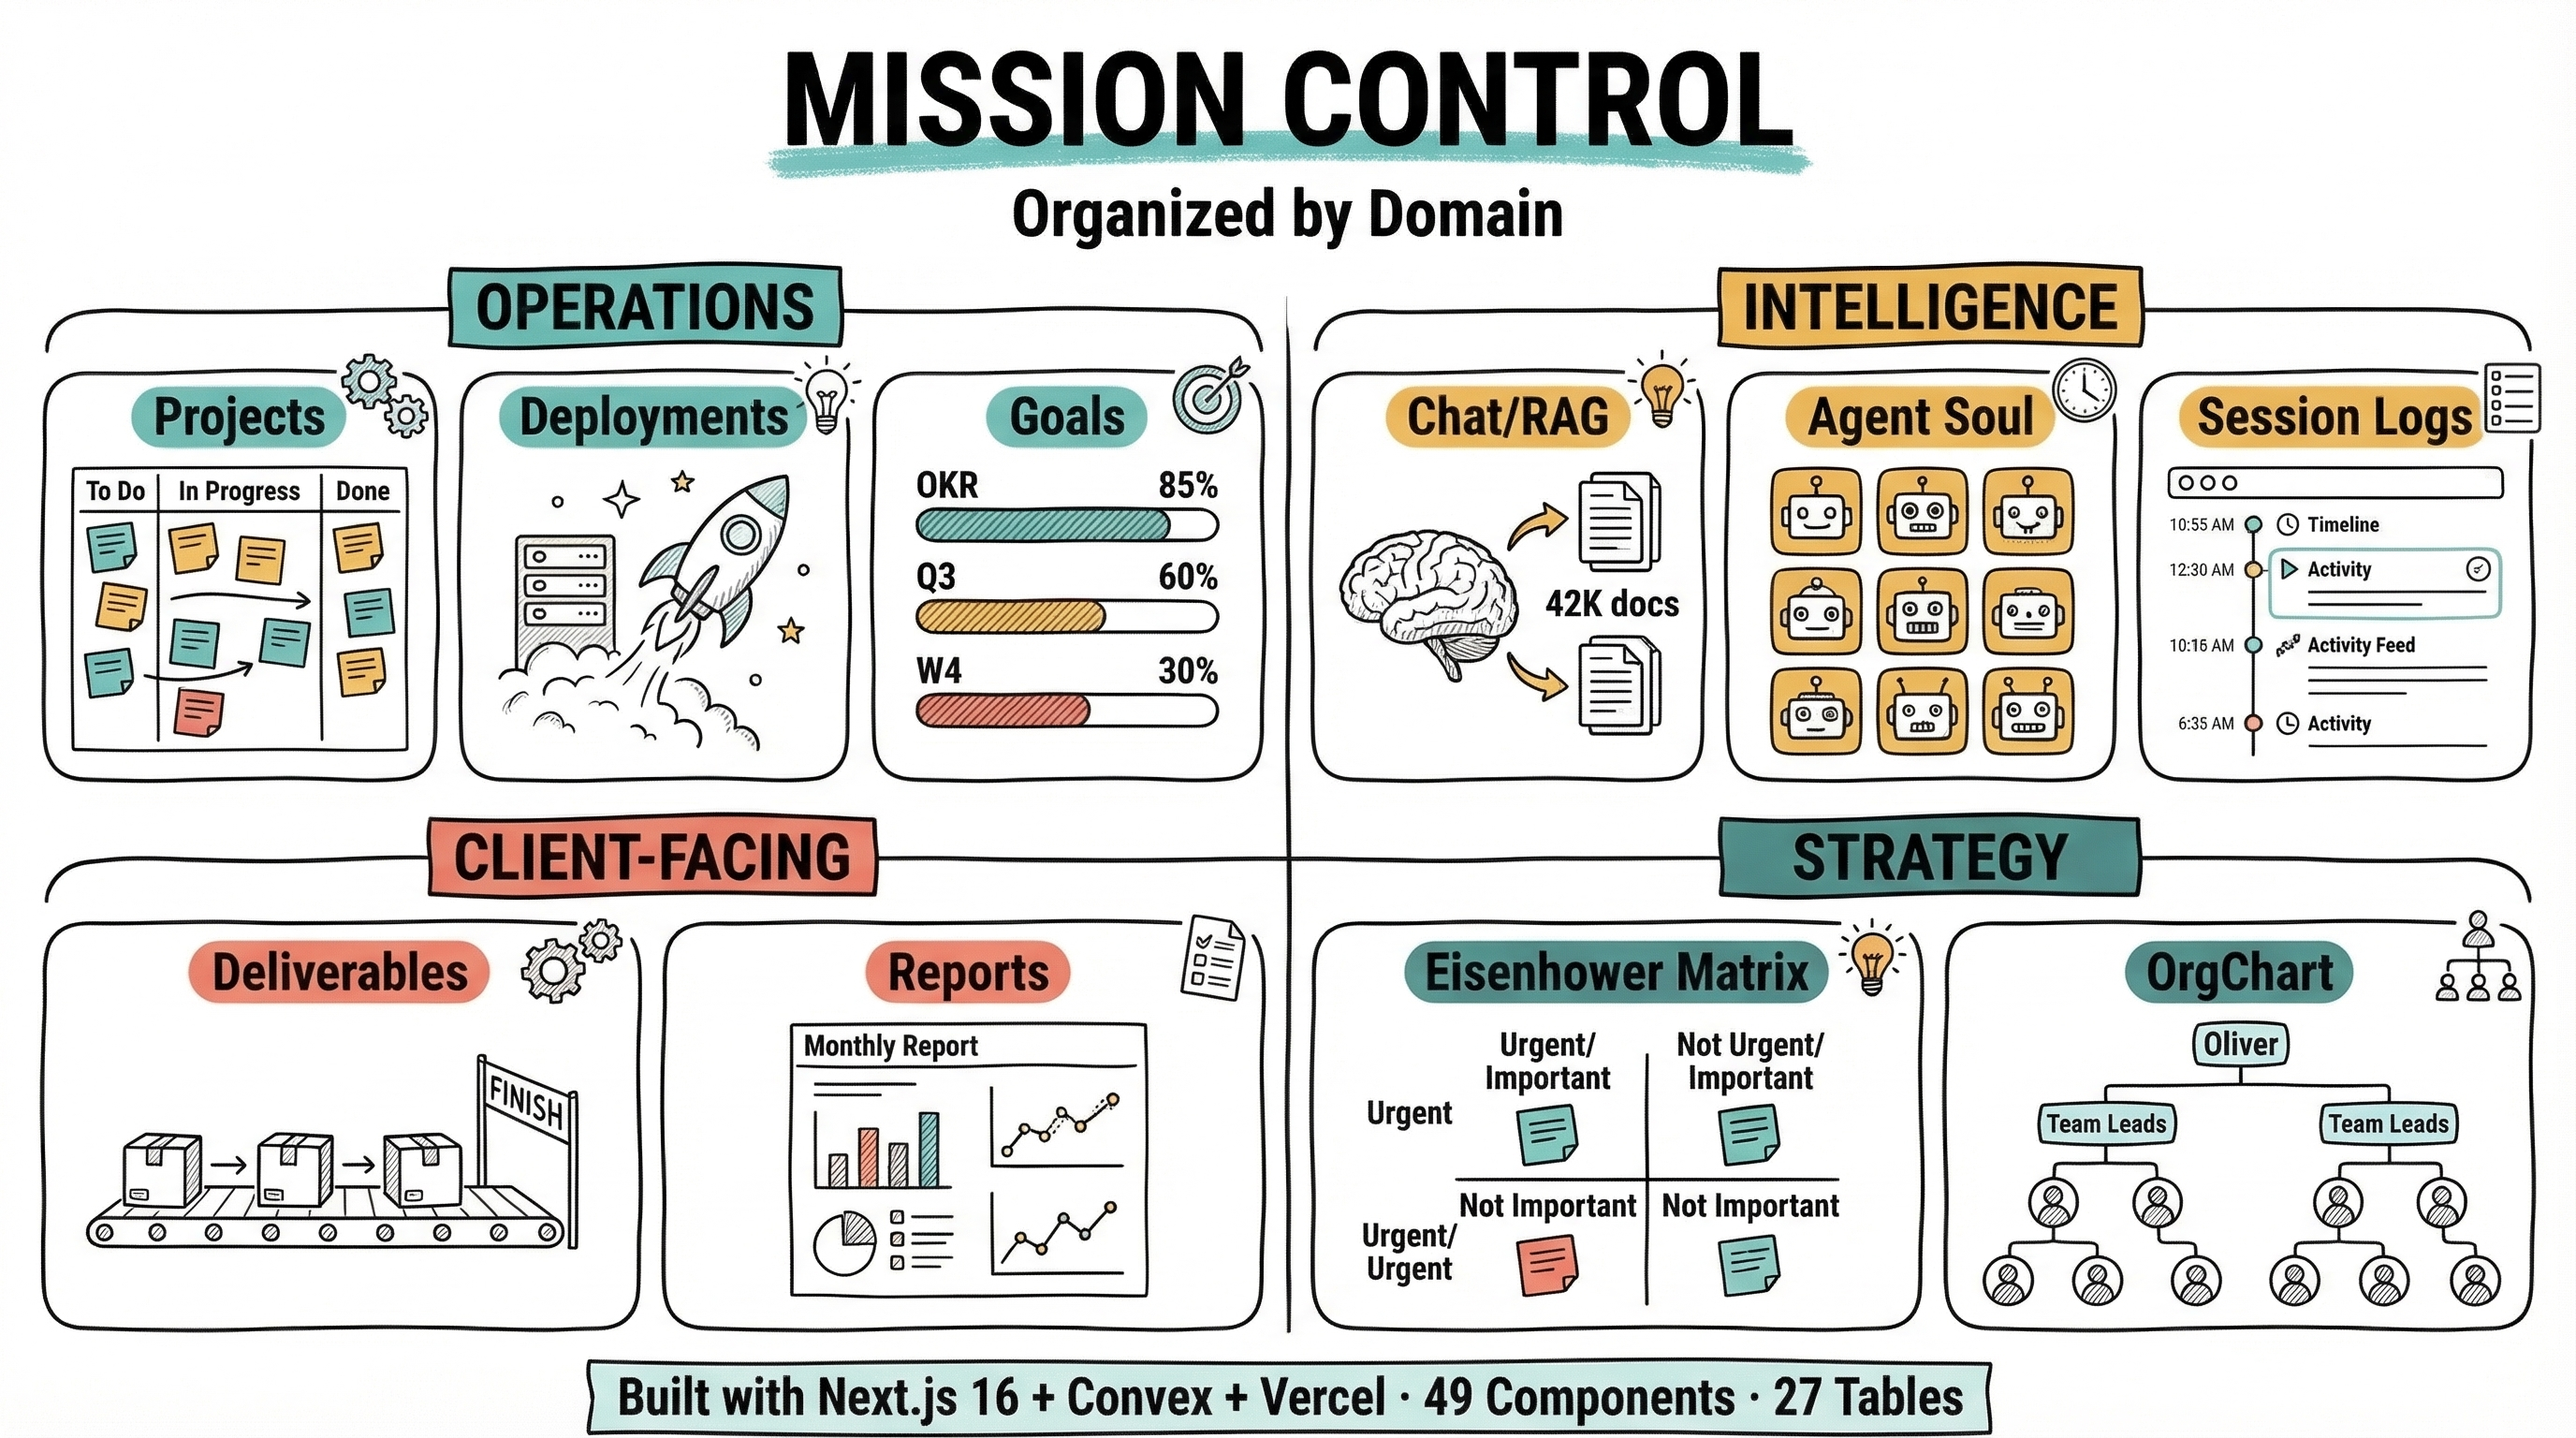
Mission Control — Agency Dashboard Hub
49 components, 27 Convex tables organized into 4 domains: Operations (Projects, Deployments, Goals), Intelligence (Chat/RAG, Agent Soul, Session Logs), Client-Facing (Deliverables, Reports), Strategy (Eisenhower, OrgChart).
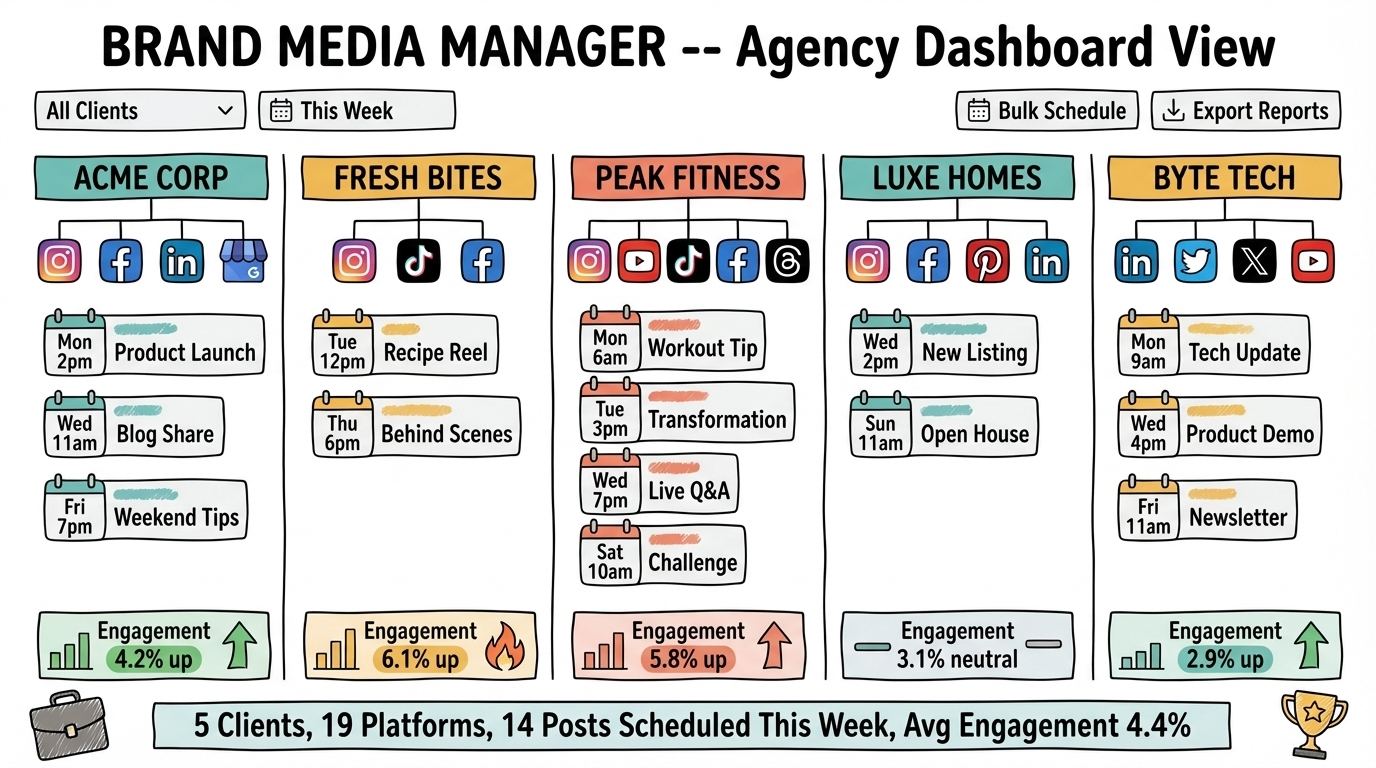
Brand Media Manager — Social Command Center
Agency dashboard view: 5 clients, 19 platforms, 14 scheduled posts, engagement metrics per client. The real multi-client management experience.
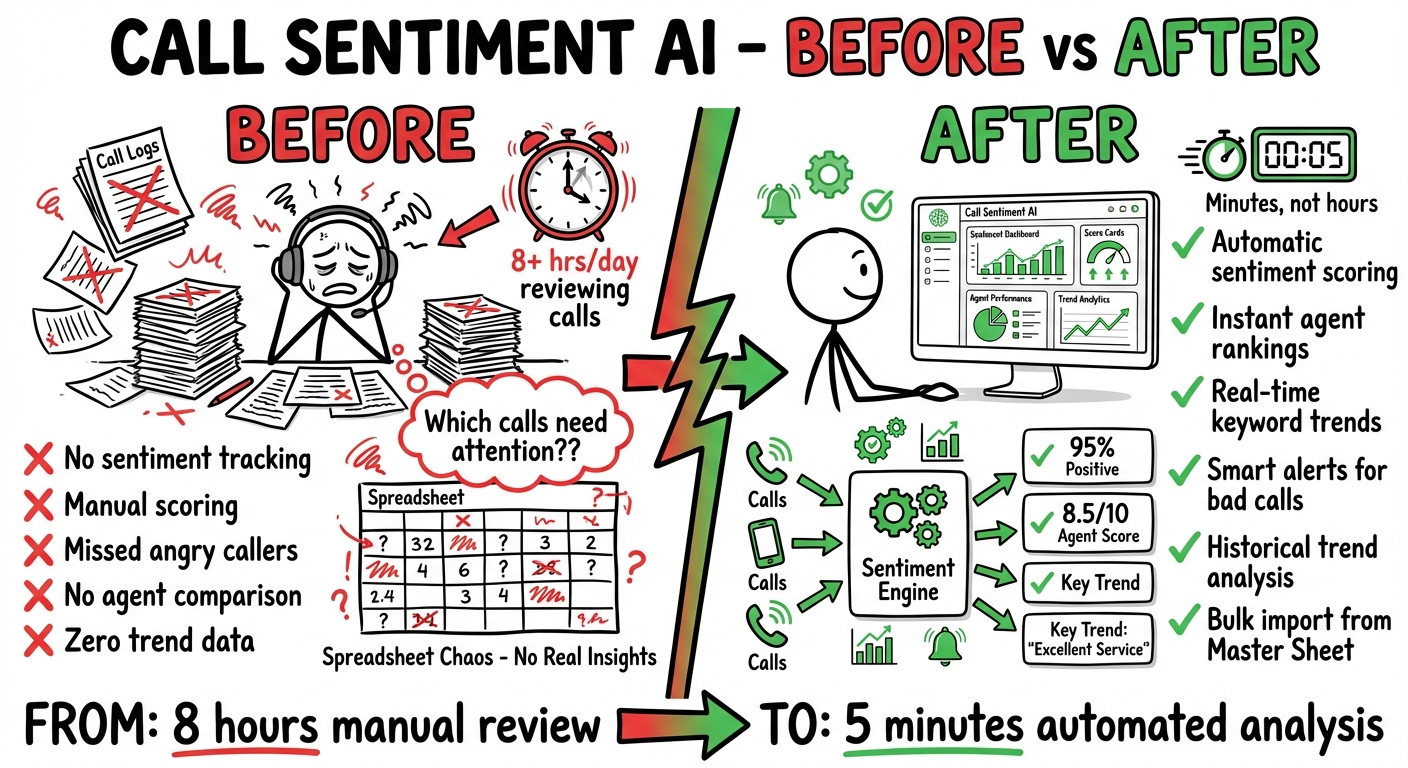
Call Sentiment AI — Call Analysis Dashboard
Before: 8 hours manual review, no insights, spreadsheet chaos. After: 5 minutes automated analysis, instant scoring, keyword trends, agent rankings.
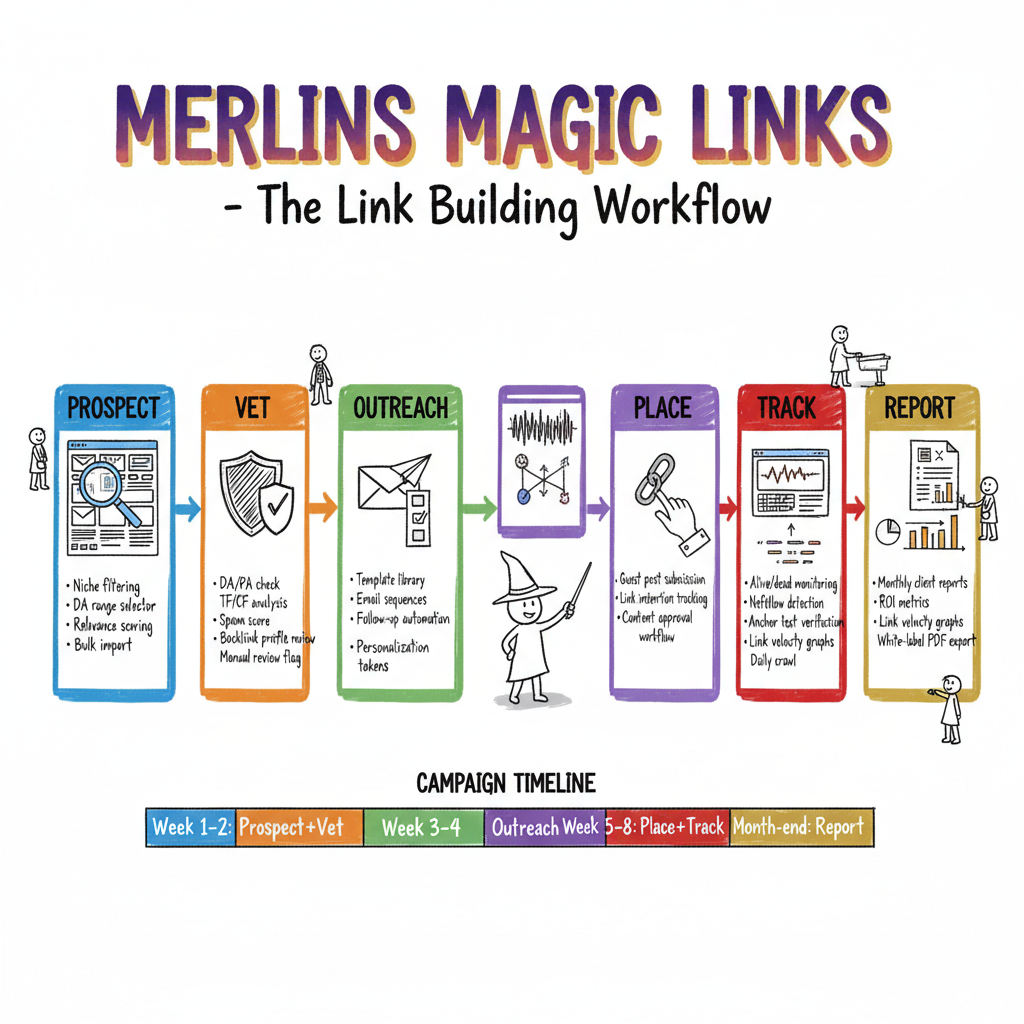
Merlins Magic Links — Link Building SaaS
6-stage workflow: Prospect → Vet → Outreach → Place → Track → Report. Campaign timeline, sub-features per stage, wizard hat branding.
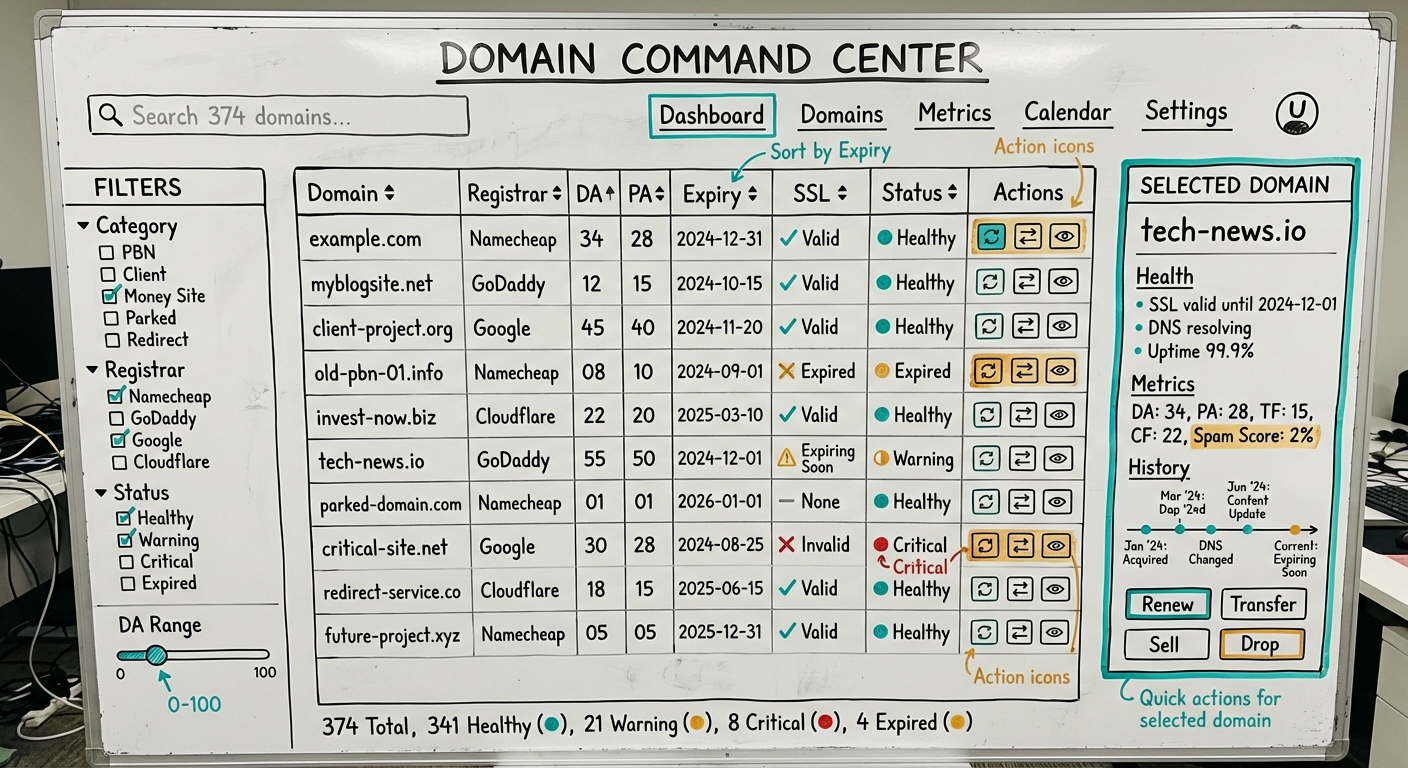
Domain Portfolio Dashboard — 374 Domains
Full command center wireframe: sidebar filters, sortable domain table with DA/PA/SSL/expiry, selected domain detail panel with health and metrics. 374 domains tracked.